Optimizing IT Services with TQM - A Case Study
260 likes | 336 Vues
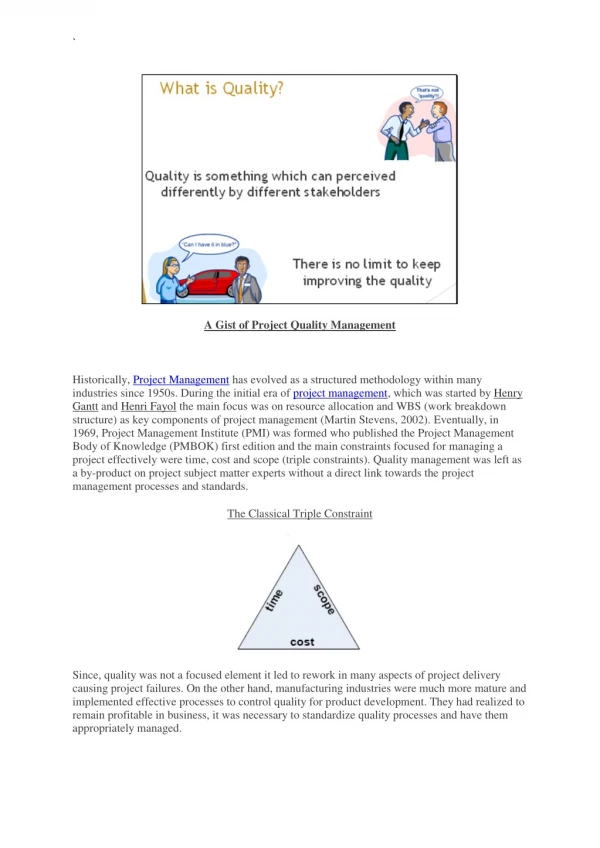
This case study showcases the implementation of Total Quality Management (TQM) in a financial services company in India to reduce IT user downtime. Steps of problem-solving, including defining the problem, analyzing root causes, and implementing countermeasures, are detailed for dramatic improvements in customer service.

Optimizing IT Services with TQM - A Case Study
E N D
Presentation Transcript
CEM-515 Project Quality Management Case Study “Reducing IT User Downtime Using TQM” By Niraj Goyal GROUP# 1 Monday, October 02, 2006
OUTLINE • Objective • Introduction • Steps of Problem Solving • Conclusion
Dramatic Improvements in Customers Services by reducingthe response time to resolve IT problems faced by internal customers using TQM OBJECTIVE
This IT case study was done during the implementation of TQM in a financial services company with several hundred computers in multiple locations throughout India INTRODUCTION
Steps of Problem Solving Define the Problem Analyze the Problem Find the Root Cause Generate & Test Countermeasure ideas Check the Results Standardize the Results Present a quality improvement report
Define the Problem Reducing the response time to resolve IT problems faced by internal customers Problem= Customer Desire – Actual Status
Availabilityof DATA Detailed data was available regarding the time of receipt of each call from the customer and the time of call closure < 30 Mins > 2 Hrs < 60 Mins < 2 Hrs < 24 Hrs > 48 Hrs < 48 Hrs Information about what happened was well recorded There was no information about what users had desired to have happen The deviation from user desires or even the service standard promised to users was not measured
Changing the mindset from data being used just as an internal record to measuring and assuring a service standard to the user Results of Defining the Problem A Pareto Diagram was drawn It indicates that two categories < 30 mins(67%) & > 120 mins ( 27%) It was decided to attack <30 mins category first
Definition of Metrics • If T30= average + 3σ of 30-mins calls closure time • T30<30 mins for a 99.7% on time performance • The past month’s data revealed: • T30=239 mins • The objective was now clearly defined: • Reduce T30 from 239 to 30 Mins
Dividing this task into Phase A reduction from 239 to 124 Mins Phase B reduction from 124 to less than 60 Mins
Step2- Phase A Analyze the Problem • The T30 calls were arranged in descending order according to actual time of closure • The most effective solution to the problem would be ending the causes of calls with a very high time of closure • Thus, T30 calls that had taken more than 130 mins were analyzed first
Step2-Phase A Analyze the Problem • The main problems for calls longer than 130 mins • Log in • Not aware of Change Rule • “Not aware of Change Rule” was chosen based on “ big & easy” principle
Step3- Phase A Find the Root Cause • In these attending to the call had not closed the call after attending to it “Five Whys” technique was used to determine the root cause Why had he not closed the call? Why was he not aware that he supposed to close the call? Why was the procedure of call closure changed and he was not informed ? Why is there no standard operating procedure to inform employees before closing the call?
Step4- Phase AGenerate & Test Countermeasure Ideas • Inform all the engineers • Develop a standard procedure for informing all users before making a change in procedure • The engineers were informed of the new procedure
Step5- Phase A Check the Results The objective of 50% reduction had been achieved Dramatic drop in the T30 value from 239 to 121 mins
Step6- Phase A Standardize the Result • A standard operating procedure was drawn up for future reference • An X Bar control chart was introduced for routine day-to-day control
Step7- Phase APresent a Quality Improvement Report Drawing up the quality improvement report was deferred to continue attempting to make further improvements
Phase BTo Further Reduce Down Time Reduce T30 value by 50% again From less than 120 mins to less than 60
Step2- Phase B Analyze the Problem • T30 calls which took more than 30 mins to close were collated and arranged in arranged in descending order • Based upon the “big& easy” principle, the group chose to attempt the printing problem first • The printing calls were subcategorized by location & solution • 7 of the 16 calls were from location 1 • 7 of the 16 calls had been solved by reinstalling the printer driver
Step3- Phase B Finding the Root Cause • The group brainstormed and generate 10 possible causes • A check sheet to collect data was designed • For the next two weeks, the engineers were asked to record the reason of the problem
Step3- Phase B Finding the Root Cause • Why was the printer going off-line? Brainstorming produced the cause The machine being used had 3 versions of the windows operating system 98, 2000 & XP If a user tried to print w/o logging-in, the printer would go off-line The next user would experience the problem
Step4- Phase BGenerate & Test Countermeasure Ideas • Adopting a new software to not allow a user to try printing w/o logging-in • All the machines using windows 98 were identified, and the change was implemented • Applying the standard operating procedure used in phase A • Inform all users of the change before implementing it
Step5- Phase B Check the Results The objective of 50% reduction had been achieved Dramatic drop in the T30 value from 121 to 47 mins
Step6- Phase BStandardize the Results A standard procedure was developed & circulated to all regions to implement the change at all locations
Step7- Phase BPresent a Quality Improvement Report A quality improvement report was written & presented to the Steering Committee
Conclusion What cannot be measured, cannot beimproved It is important to develop customer-oriented metrics There is value in step by step & continuous improvement