Sampling Distribution and the Central Limit Theorem
120 likes | 243 Vues
Learn about Sampling Distributions, Central Limit Theorem, Sample Means, Properties, and Significance. Discover how to use sample statistics for population inferences. Understand normal distributions and the t-Distribution.

Sampling Distribution and the Central Limit Theorem
E N D
Presentation Transcript
Sampling Distributions – Sample Means Instead of working with individual scores, statisticians often work with means. Several samples are taken, the mean is computed for each sample, and then the means are used as the data, rather than individual scores being used. The sample is a sampling distribution of the sample means. The sampling distribution of the sample mean is a probability distribution consisting of all possible sample means of a given sample size selected from a population.
Sampling Distributions Properties of the Sampling Distribution of the Sample Means. 1. The mean of the sample means will be the mean of the population. 2. The variance of the sample means will the the variance of the population divided by the sample size 3. The standard deviation of the sample means ( known as the standard error of the mean) will be smaller than the population standard deviation and will be equal to the standard deviation of the population divided by the square root of the sample size. continued
Sampling Distributions (Contd.) 4. If the population has a normal distribution, then the sample means will have a normal distribution 5. If the population is not normally distributed, but the sample size is sufficiently large, then the sample means will have an approximately normal distribution. The standard deviation of the distribution of a sample statistic is known as the standard error of the statistic. continued
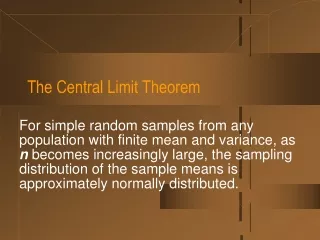
The Central Limit Theorem • If a random sample is drawn from any population, the sampling distribution of the sample mean is approximately normal for a sufficiently large sample size ( n > 30). • The larger the sample size, the more closely the sampling distribution of will resemble a normal distribution. CENTRAL LIMIT THEOREM - If all samples of a particular size are selected from any population, the sampling distribution of the sample mean is approximately a normal distribution. This approximation improves with larger samples.
Central Limit Theorem • If the population follows a normal probability distribution, then for any sample size the sampling distribution of the sample mean will also be normal. • If the population distribution is symmetrical (but not normal), shape of the distribution of the sample mean will emerge as normal with samples as small as 10. • If a distribution that is skewed or has thick tails, it may require samples of 30 or more to observe the normality feature. • The mean of the sampling distribution equal to μ and the variance equal to σ2/n.
Sampling Distributions The significance of the central limit theorem is that it permits us to use sample statistics to make inferences about population parameters without knowing anything about the shape of the frequency distribution of that population other than what we can get from the sample Regardless of the nature of the population distribution-discrete or continuous, symmetric or skewed, unimodal or multi- modal- the sampling distribution of mean is always nearly normal as long as the sample size is large enough. Sufficiently large : at least 30
Using the Sampling Distribution of the Sample Mean • IF SIGMA IS UNKNOWN, • OR IF POPULATION IS NON NORMAL • If the population does not follow the normal distribution, but the sample is of at least 30 observations, the sample means will follow the normal distribution. • If the population standard deviation is not known, to determine the probability a sample mean falls within a particular region, use: IF SIGMA IS KNOWN • If a population follows the normal distribution, the sampling distribution of the sample mean will also follow the normal distribution. • If the shape is known to be nonnormal, but the sample contains at least 30 observations, the central limit theorem guarantees the sampling distribution of the mean follows a normal distribution. • To determine the probability a sample mean falls within a particular region, use:
Population Standard Deviation (σ) Unknown – The t-Distribution CHARACTERISTICS OF THE t-Distribution 1. It is, like the z distribution, a continuous distribution. 2. It is, like the z distribution, bell-shaped and symmetrical. 3. There is not one t distribution, but rather a family of t distributions. All t distributions have a mean of 0, but their standard deviations differ according to the sample size, n. 4. The t distribution is more spread out and flatter at the center than the standard normal distribution As the sample size increases, however, the t distribution approaches the standard normal distribution In most sampling situations the population standard deviation (σ) is not known.
Using the Sampling Distribution of the Sample Mean (Sigma Known) - Example Solution: Step 1: Find the z-values corresponding to the sample mean of 31.38 Step 2: Find the probability of observing a Z equal to or greater than 1.80 Conclusion: Less than a 4 percent chance, that we find the sample mean equal to or greater than 31.38 ounces. EXAMPLE The Quality Assurance Department for Cola, Inc., maintains records regarding the amount of cola in its Jumbo bottle. The actual amount of cola in each bottle is critical, but varies a small amount from one bottle to the next. Cola, Inc., does not wish to underfill the bottles. On the other hand, it cannot overfill each bottle. Its records indicate that the amount of cola follows the normal probability distribution. The mean amount per bottle is 31.2 ounces and the population standard deviation is 0.4 ounces. At 8 A.M. today the quality technician randomly selected 16 bottles from the filling line. The mean amount of cola contained in the bottles is 31.38 ounces. What is the probability of content to be greater than 31.38 ounces?