Strategic Sales and Operations Planning: Improving Supply Chain Efficiency
510 likes | 724 Vues
Learn the significance of Sales and Operations Planning (S&OP) in organizational strategy, tackle strategic and tactical considerations, master optimization techniques, and understand various S&OP approaches and their effectiveness. Explore capacity options and planning values for effective resource allocation.

Strategic Sales and Operations Planning: Improving Supply Chain Efficiency
E N D
Presentation Transcript
Chapter Objectives Be able to: • Distinguish among strategic planning, tactical planning, and detailed planning and control. • Describe why sales and operations planning (S&OP) is important to an organization and its supply chain partners. • Generate multiple alternative sales and operations plans. • Describe the differences between top-down and bottom-up S&OP and discuss the strengths and weaknesses of level, chase, and mixed production strategies. • Discuss the organizational issues that arise when firms decide to incorporate S&OP into their efforts. • Examine how S&OP can be used to coordinate activities up and down the supply chain. • Apply optimization modeling techniques to the S&OP process.
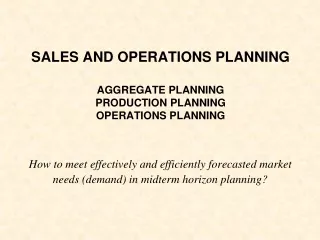
Sales and Operations Planning Involves: • Strategic and tactical considerations • Top-down planning • Bottom-up planning • Optimization techniques
Sales and Operations Planning (S&OP) • Purpose: Select capacity options over the intermediate time horizon • Capacity options: • Workforces • Shifts • Overtime • Subcontracting • Inventories • etc.
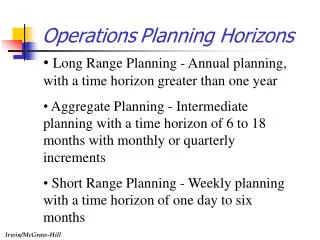
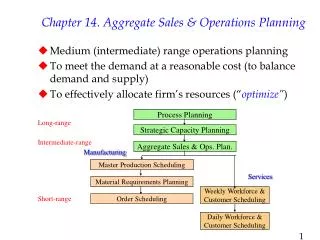
S&OP continued (2 - 18 months out) • Outside of time frame strategic planning • Inside of time frame tactical planning “Big Picture” approach to planning • Families or groups (aggregation) of: • Products • Resources • Technologies or skills • Provide “rough” estimates
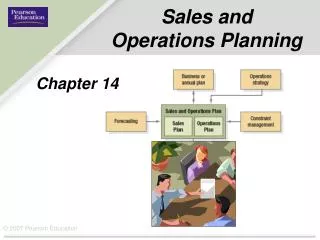
Long-Range Plans S&OP Short-Range Plans Position in the Overall Business Planning Cycle
Inputs to the Process • Demand Management • Forecasts of customer demand • Need for spares, etc. • Pricing • Strategic Capacity Levels • Existing buildings • Processes S&OPs • External Capacities • Suppliers • Subcontractors
Advantages of S&OP • Negotiated process • “Agreed” demand • Functional coordination • Budgets and cash flow analyses • Reduces operations and supply chain tasks to “meeting the plan”
Top-Down Similar products OR stable mix Standards available for planning time, cost requirements from history and/or planning documentation Can “Average” product Bottom-Up Different products AND unstable mix Requires forecasts and production data for individual products Can be extremely data-intensive S&OP Approaches
Planning Values Translate forecast into: • Resources required • Labor hours per unit • Material quantities • Equipment hours • Subcontractors? • Costs • Materials • Labor • Subcontractors? • Hiring/firing costs • Inventory holding costs
Top-Down Planning • Develop the aggregate sales forecast and planning values. • Translate the sales forecast into resource requirements. • Personnel, equipment, materials • Generate alternative production plans. • Chase, level, mixed Select the best of the plans. • Lowest cost, best fit to capability
Top-Down Example II(“Average” Products) 10%(40) + 60%(20) + 20%(15) + 10%(10) = 20 hours
Top-Down Example III(Conditions or Constraints) • Agreed upon demand to be met for upcoming 12 month period • Can vary workforce and inventory levels • No backordering • “Average” unit requires 20 worker hours • Each worker works 160 hours per month
Top-Down Example V(Other tidbits of data …) • Start and end with 100 workers (goal) • Start and end with about 100 units in inventory (goal) The above conditions allow fair cost comparisons of various aggregate plans.
Pennington Cabinet • Strategic Capacity Level: 848 jobs per month • Company produces make-to-stock cabinets for sale at Lowe’s, etc. • Planning values: • Average hours of labor per cabinet = 20 hours • Regular production cost = $2000 per cabinet set • Overtime production cost = $2062 per cabinet set • Average monthly holding cost = $40 per cabinet set • Hours per month per employee = 160 hours • Hiring cost = $1750 per employee • Layoff cost = $1500 per employee • Allowable overtime = 16 hours per employee
Pennington (continued) Raw Demand for next 7 months: January 750 jobs February 760 March 800 April 800 May 820 June 840 July 910 What are our options . . . ?
Pennington (again) . . . Raw Demand 1000 Monthly capacity = 848 500 Need 910 July
Detail of First Seven Months from LevelStrategy Note: We develop a level strategy by setting “Actual Employees” equal to the average required for the 12 month planning period
Detail of First Seven Months from Chase Strategy Note: We develop a chase strategy by setting “Actual Employees” equal to the number needed in each period subject to maximum capacity constraint of 848 (see July, here remaining demand of 62 units is done by using overtime).
Mixed Strategy A compromise between level and chase plan extremes to reduce total cost.For the Pennington example, we • Keep 100 employees at beginning, which builds up inventory slowly • Reduces hiring/layoff costs by only changing workforce gradually • Use overtime only toward the end of the year.
Top-Down Example(Other Issues …) • Are complete costs shown? • Expand out for budget and cash flow analysis • “Input” (suppliers) and “output” (logistics and warehousing) considerations • Lead time, materials availability, storage space? • Variations in actual production • Scrap, rework, equipment breakdowns
Top-Down Option(We could subcontract production) • Maximum subcontract of ??? units/month.. • Cost is more per unit than internal production cost • Will this option: • 1) increase costs? • 2) decrease costs? • 3) have no effect on costs? • Issues: • Quality? • Source of materials (separate supplier allowed?) • Loss of proprietary information
Cash Flow Analysis Net cash flow = cash inflows – cash outflows Different sales scenarios can have significant effect on cash flow as shown for the Pennington example in the text.
Advanced Topic:Optimization Modeling • What is optimization modeling? • Essential conditions • Application to operations problems
Family of mathematical techniques used to allocate limited resources among competing demands in an optimal way What is our financial objective? What are our constraints? Optimization Modeling
Optimization Example 1 Product mix: Find the product mix that will maximize revenue, given limits on materials, labor hours, and machine hours available
Optimization Example 2 S&OP: Find the workforce and inventory levels which will minimize hiring, layoff, and inventory costs while still meeting demand.
Choosing Between Plans • Effect on supply chain partners? • What are the cash flows like? • Is there space for the inventory? • Effects on the workforce morale? • Is staffing available when needed? • How flexible is the plan?
Options for Services • Smooth out demand: • Appointments • Discounts and promotions • Seasonal complements • Yield management • Tiered workforce: • Full-time and part-time • Customer involvement (offloading)
Linking S&OP Throughout the Supply Chain Good information systems (EDI) are necessary for success, flexibility, and reducing uncertainty
S&OP Optimization • Maximize profit or revenues subject to resource constraints • Minimize costs subject to demand requirements Two major types of problems
OptimizationEssential Conditions I • Explicit objective function • Maximize revenue or profit • Minimize costs 2. Some constraint(s) • Resource limits • Demand requirements
OptimizationEssential Conditions II • Conditions can be expressed mathematically Revenue = $1000X Variable cost = $310X Assembly hours needed = 15X • Divisibility OK to make half a unit or hire two thirds of an individual
Optimization Example 1 Transportation Problem:Minimize the cost of shipping items from different plants to different stores
Optimization Example 2 Material Yield: Minimize the amount of scrap generated by cutting steel, fabric, wood, etc. ScrapMaterial
Minimization Problem S&OP: “Meet the production plan with the minimum total hiring, firing, and inventory cost” • Can you figure out how the problem would be defined?
What to Take Away from this ... • Essential conditions: • Explicit objective function • Constraints • Linearity • Divisibility • Write out an objective function or constraint for simple problem • Can use Excel Solver
Case Study in S&OP Covolo Diving Gear, Part 2