Download
1 / 16
160 likes | 281 Vues
This study examines the fluctuation and variability of atmospheric hydroxyl radicals (OH) since pre-industrial times, detailing influences from various factors such as meteorological changes, anthropogenic emissions, and stratospheric ozone levels. Data covers specific percentage changes as reported by various studies and uses global chemical transport models to simulate conditions from 1979 to 1993. Findings suggest OH concentrations remained relatively stable, while trends in emissions and meteorology largely explain the variances observed. Key implications for understanding OH's role in atmospheric chemistry are discussed.

E N D
Since pre-industrial times OH changed by: • +7 % [Berntsen et al.. JGR, 1997; Martinerie et al., JGR,1995] • - 9 % [Wang and Jacob, JGR, 1998] • -15 % [Lelieveld and Dentener, 2000]
Since pre-industrial times OH changed by: • +7 % [Berntsen et al. JGR, 1997; Martinerie et al., JGR, 1995] • - 9 % [Wang and Jacob JGR, 1998] • -15 % [Lelieveld and Dentener, JGR, 2000] Recent methyl-chloroform inversions predict: • 15 ± 22 % for the period 1979-1989 (1.4 % year-1) • - 25 % for the period 1990-2000 (-2.3 % year-1) [Prinn et al., JGR, 2001; Krol and Lelieveld, JGR, 2002]
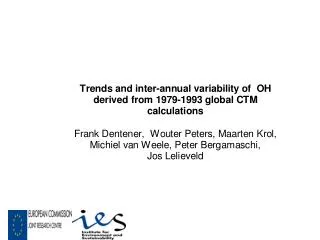
What is the consistency of our knowledge on large scale • OH variability and trends in the period 1979-1993? • Changes in meteorology • Changes in anthropogenic emissions • Changes in stratospheric ozone • Why 1979-1993? • Meteorology from ECMWF-ERA15 re-analysis used by global CTM TM3 • Emissions from EDGAR/Historical Emission database • CH4 from surface network • Stratospheric O3 from TOMS
Experiments: • Varying meteorology and photo-chemistry 1979-1993 • Fixed meteorology (1993), varying emissions • Varying meteorology and constant emissions • … in total eight combinations …. • Analyze OH changes as CH4 lifetime.
O3 [ppbv] at earth surface: simulated-measurements 1979-1993 Measurement Model [Lelieveld and Dentener, JGR, 2000; Peters et al., JGR, 2000]
CH4 emissions: Calculated - Edgar/HIS [Dentener et al., ACPD, 2002] Residual CH4 emissions: variability of natural emissions and unaccounted trends…. See poster [Dentener et al.]
ECMWF Inter-annual variability of column moisture (1979-1993) 5 periods 50 40 30 20 10 5 0 10% 5% 0% -5% -10% BLUE: DRYGREEN-YELLOW: WET
Change of anthropogenic emissions 1979-1993 (interpolated from van Aardenne et al., GBC, 2001)
CH4 lifetime: full simulation-meteorology-chemical boundary conditions S1 base sim.[-0.24 ±0.06 % year-1] S2 Var meteo. [-0.20 ±0.09 % year-1 ] S3 Var Chem. [-0.02 ±0.05 % year-1 ] Multiple linear regression: 0.53-0.47, with high probability.
CH4 lifetime:effect of humidity and scavenging on ‘meteorology simulation’ S2: Var. Meteo[-0.20 ±0.09 % year-1] S7: Var. Humidity[-0.13 ±0.09 % year-1 ] S8: Var. Scavenging [0.05 ±0.05 % year-1 ]
CH4 lifetime:effect of emissions and photolysis rates on ‘chemistry only’ simulation S3: Var. Chemistry [-0.02 ±0.05 % year-1] S4: Var. TOMS [-0.15 ±0.05 % year-1 ] S6: Var Emissions [0.12 ±0.01 % year-1 ]
Summary: • Many factors that control OH variability have been included in global • CTM with 15 years of real meteorology- as good as we can do it... • OH has been relatively stable during 1979-1993 [0.24 ±0.06 % year-1] • which does not support reports on strong OH changes. • Meteorological variability, and especially water vapor, explains most of the • variability and much of the calculated trend • Trends in stratospheric ozone increase OH, changes in surface emissions • decrease OH; effects cancel. • Computed OH variability probably underestimated since we did not assess • the role of variations in natural emissions (biomass burning!)
CH4 lifetime:correlation of ‘chemical’ simulation and solar cycle Lifetime Solar cycle index Solar cycle index Lifetime Solar cycle index Lifetime
O3 [ppbv] at earth surface: simulated-measurements 1979-1993 Average O3 seasonal cycle [ppbv] Measurement Model Model Stratosphere [Lelieveld and Dentener, JGR, 2000; Peters et al., JGR, 2000]