Download

1 / 18
180 likes | 378 Vues
Measurement of EKG. Removing the Mysteries http://course1.winona.edu/LReuter/212/2012. From where does the EKG signal arise?. View the heart as a signal source. The signal center moves. The signal amplitude varies. From where does the EKG signal arise?.

E N D
Measurement of EKG Removing the Mysteries http://course1.winona.edu/LReuter/212/2012
From where does the EKG signal arise? View the heart as a signal source. The signal center moves. The signal amplitude varies
From where does the EKG signal arise? • Depolarization of cardiomyocytes and Purkinje Fibers • Repolarization of cardiomyocytes and Purkinje Fibers • De/re/polarization results in a change of transmembrane ions in a heart region • The de/re/polarization change migrates to different regions of the heart • The de/re/polarization signal is greatest when many cells have polarization changes at the same time • Other de/re/polarizations, such as from skeletal muscle contraction, can interfere with the heart signal • Many different ions (Na+, K+, Ca++, Cl- contribute to the electrical measurement
ELECTRODES – measure voltage • Bipolar Electrodes: • Measure the electrical difference between two points • Example: Leads: I, II, & III • Unipolar Electrodes: • Measure the electrical difference between one point and an established zero reference point. • Example: Leads: aVR, aVL, aVF, V1, V2, V3, V4, V5, & V6
LEADS – specify location of electrodes • Limb Leads I, II, III, aVL, aVR, aVF • Measure the electrical difference in the Frontal Plane (has directions of Left->Right & Inferior->Superior) • a == augmented (an electrode arrangement to increase signal and change the axis of measurement hexaxial reference system.) • V == vector (a quantity that has magnitude and direction) • Precordial Leads V1, V2, V3, V4, V5, & V6 • Measure the electrical difference in the Transverse Plane (has directions of Left->Right & Anterior->Posterior)
Einthoven’s Triangle Precordial Leads V1, V2, V3, V4, V5, V6 In Transverse Plane Limb Leads Right Left Foot In Frontal Plane aVR aVL aVF
The Positioning of Electrodes is Important • When an electrical signal from the heart arrives at two electrodes at different times, a voltage will appear between the two electrodes. (The velocity of an electrical signal in tissue is ~0.1C) • For LA and RA, place the electrodes on corresponding parts of the anatomy: the two wrists, the two elbows, the two shoulders. • Try to keep an Einthoven triangle between limb electrodes, with the heart in the triangle’s center. • Try to keep electrodes away from major skeletal muscles, especially when patient is ambulatory.
LEAD I: (+)LeftArm; (-)RightArm • Measures electrical potential difference from the mid-sagittal plane == 0 degrees axis • Measures along an axis corresponding to the base of Einthoven’s Triangle • Measures mainly across the heart - + - +
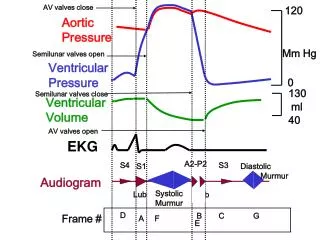
An EKG Trace Baseline = end of P wave Y dimensions = mV or µV X dimensions = sec or mm/sec
LEAD II: (+)LeftLeg; (-)RightArm • Measures electrical potential difference from a plane that has been rotated 60 degrees from the mid-sagittal plane == 60 degree axis • Measures along an axis corresponding to the right side of Einthoven’s Triangle (on patient’s right side) • Measures approximately along the length of the heart - - 0v + +
LEAD III: (+)LeftLeg; (-)LeftArm • Measures electrical potential difference from a plane that has been rotated 120 degrees from the mid-sagittal plane == 120 degree axis • Measures along an axis corresponding to the left side of Einthoven’s Triangle (on patient’s left side) • Measures approximately across the width of the heart - - + + 0v
More Leads: Hexaxial Reference System • Augmented leads, with a “constructed reference zero” • aVR (+)RightArm(-) ½[LeftArm+ LeftLeg] == [I +II]/2 • aVL (+)LeftArm(-) ½[RightArm + LeftLeg] == I – [II/2] • aVF (+)LeftLeg(-) ½[RightArm + LeftArm] == II – [I/2] • One electrode is a basic Limb Lead • The other electrode is an average of the two remaining basic Limb Leads • The augmented leads have axes that are located between those of the basic Limb Leads • Allows for an easier estimation of the Mean Electrical Vector
Meaning of trace deflection • Positive components: • Potential increasing in the positive axis direction • Potential decreasing in the negative axis direction • Negative components: • Potential decreasing in the positive axis direction • Potential increasing in the negative axis direction • No measurable components: • No change in electrical potential • Identical changes in electrical potential Views From Different Axes:
Limb Leads: Mean Electrical Vector in frontal plane: may show greatest magnitude along axis of a particular lead, but two axes are needed to accurately establish MEV.
Determining the Cardiac QRS Mean Electrical Vector All measured waves and segments of the EKG have associated electrical vectors. We will measure the MEV of the QRS complex (waves). The most accurate measurement requires a measurement of the area under the three waves; we are more interested in the angle of the MEV and will estimate area by the amplitude of each wave. Obtain graphic recordings of at least two Limb Leads, such as Lead I and Lead II. Make a 0o, 60o, 120o triaxial graph with correct axes for these Leads, as shown below. Establish a base line (using the PR segment, from the end of the P wave to the beginning of the Q wave). From the base line (zero) Measure the (+/- signed) amplitudes of the Q, R, and S waves . If your two Leads have different Y scales, convert the amplitudes to millivolts. Algebraically add the Q, R, and S amplitudes to achieve a parameter of the QRS complex area. Plot the resultant amplitudes on the respective Lead axes. Draw equipotential perpendiculars at the ends of each vector. Draw a line from the origin to the intersection of the equipotential lines. This vector is the MEV, which has magnitude and direction of the mean electrical axis View example on the next slide. (-) (-) (-) 0 (+) Lead I [+0o] (+) Lead II [+60o] (+) Lead III [+120o]
MEV Example: 11 mV; invCos-[3/-11]=74o Lead I Equipotential Line (-) (-) Lead I: 6mV R -0.5mV Q – 2.5mV S = 3mV Lead III Equipotential Line 3mV (-) 0 (+) Lead I [+0o] 7mV 10.5mV 11mV Lead II: 13mV R -1.5mV Q - 0mV S = 10.5mV (+) Lead II [+60o] (+) Lead III [+120o] Lead III: 8mV R -1mV Q - 0mV S = 7mV Lead II Equipotential Line