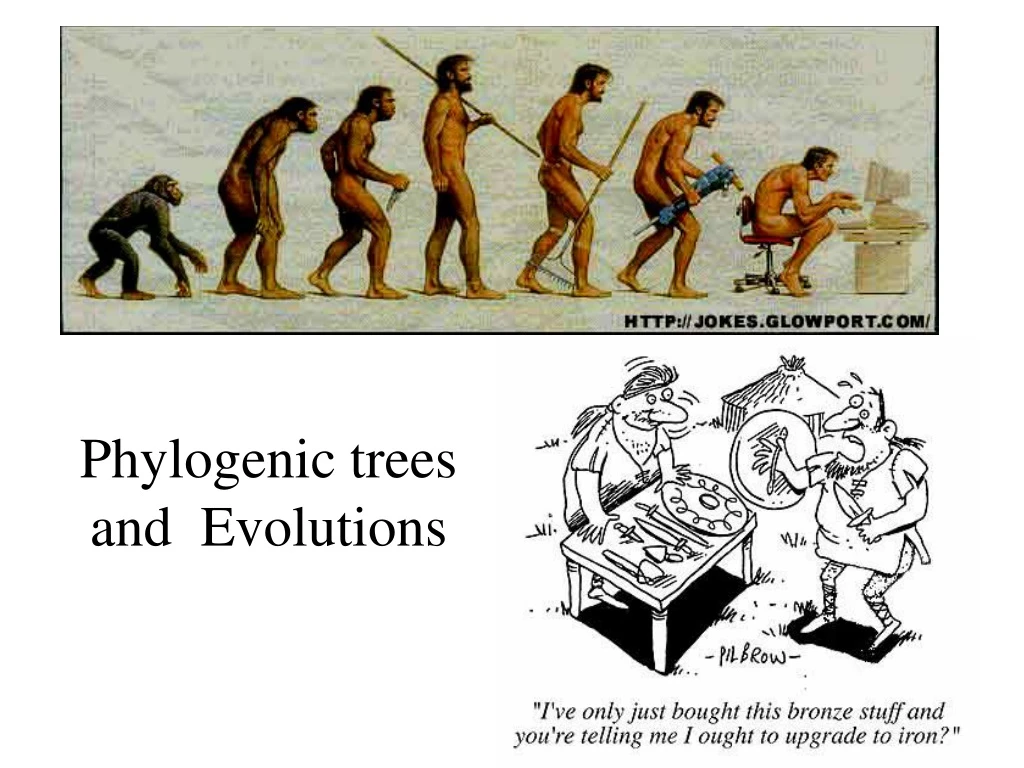
Genetic Evolution Through Phylogenetic Trees: From Ancient Ancestors to Modern Human Populations
580 likes | 610 Vues
Explore the steps involved in building a phylogenetic tree, including determining the substitution model and evaluating the tree for various applications. Learn about the mitochondrial and Y chromosomes, haplogroups, common ancestors, and dating mutational events. Understand methods like the Midpoint Method and Outgroup Method for rooting phylogenetic trees and assessing the statistical significance of genetic mutations.

Genetic Evolution Through Phylogenetic Trees: From Ancient Ancestors to Modern Human Populations
E N D
Presentation Transcript
Basic Steps Alignment Determining the substitution model Methods for Building a phylogenetic tree Tree evaluation
The mitochondrial chromosome • About 15kb of mtDNA • Mutates quite rapidly • In eggs but not sperm, so shows maternal inheritance
The human Y chromosome • The mammalian X and Y chromosomes evolved from a pair of autosomes • The human Y has a block of material that transposed (moved) from the X since the divergence of chimps and humans
Dating the mutational events • The Y chromosome also has rapidly-mutating microsatellites • The older a mutation, the more diverse microsatellite alleles associated with it Haplogroup
Human Origins Mya 0.1 5 4 3 2 1 0 Australopithecus Early Homo sp H sapiens Neanderthals Mya = million years ago
Common ancestor? • If human beings have many ancestors, there should be many mtDNAs. • The female mtDNAs of all human races in the present world are the same. • Therefore we have only one common ancestor.
121 native Africans: 25 !Kung 27 Herero 1 Naron 17 Hadza 14 Yorubans 20 Eastern Pygmies 17 Western Pygmies 68 additional individuals: 20 Papua New Guineans 1 Native Australian 15 Europeans 24 Asians 8 African Americans We find 189 individuals to study :
Basic results • People with identical mtDNA types were not found in Europeans and Asians. Only within Africanor Papua New Guinea populations. • There was no sharing of mtDNA types among people from different populations, with one apparent exception : a Yoruban and an African American • African Americans stem mainly come from West Africa • Strong geographic specificity (7, 16, 20, 25)
To convert the resulting network into a tree • Tree found using MP • The ancestor or root must be found. • We need additional information or assumption. • Midpoint Method? Outgroup Method? (28)
Midpoint Method A d (A,D) = 10 + 3 + 5 = 18 Midpoint = 18 / 2 = 9 C 10 3 2 2 5 B D Roots the tree at the midway point between the two most distant taxa in the tree, as determined by branch lengths.
Outgroup Method outgroup Uses taxa (the “outgroup”) that are known to fall outside of the group of interest (the “ingroup”). Requires some prior knowledge about the relationships among the taxa.
Using the Midpoint Method • Assume that the rate of evolution has been the same in all lineages. If the evolution rate in African were fast, Rooting by this method wouldn’t indicate an African origin. • The tree might not yield any information regarding the geographic origin of the mtDNA ancestor. • So they gave up the midpoint method.
Root the tree by Midpoint Method Real Root 1 1 Root by Midpoint Method 0.5 1 0.5 1 1 1 1 Back
Using the Outgroup Method • The outgroup attaches to the position that minimize the total number of mutations. • Problem : High-resolution restriction maps of African ape mtDNA were not available. • Solution : A control region sequence from a common chimpanzee sequence was used to root the tree. (29)
Classical results • All contemporary human mtDNAs trace back through maternal lineages to an ancestral mtDNA present in an African population some 200,000 years ago. (7) • But there exists weakness of Cann et al.’s study: (10~14) • Restriction analysis • Small sample made up largely of African Americans • Using inferior method(midpoint method) to root • No statistical justification is given • Inadequate calibration of rate of human mtDNA evolution Now, all of the above problems have been solved!
Phylogenetic Tree Relating the 135 mtDNA Types Markings in the branches indicate the 31 African clusters of mtDNA types
Geographic Origin • The outgroup rooting divides the tree into two primary braches. Ancestor All remaining mtDNAs 6 African mtDNA types
These 14 deep African branches provide the strongest support yet for the placement of common human ancestor in Africa. (32)
How do we assess the statistical significance? • Winning Sites Method • Geographic States Method
Winning Sites Method • How many additional mutations would be required to produce a tree whose branching order implies that the ancestor live other than Africa? • Is this number significant more than the number of mutations in the minimum length, African origin tree? • This method does by comparing the number of mutations required by two alternative trees. • A tree is said to win at a nucleotide position if fewer changes are required at the position.
The deepest non-African lineage Type 23 • Moving type 23 to the common ancestral stem produce a tree that requires 11 more mutations than the minimum length, African origin tree. • The winning site method determines whether these 11 mutations are significantly more than would expected if both trees are consistent with the data • By applying the test, the African origin treewins at more sites than the alternative tree
Geographic states method • This method isn’t concerned with the number of mutations, but with the distribution of geographic states for a particular tree. • Focus : The first 14 branches in the tree lead exclusively to African mtDNA types. • This method estimates the probability that this pattern of 14 deepest branches all being African would have arisen by chance along. And the majority of mtDNAs examined were African.
Hypergeometric Distribution • For example: If there are 3 red balls and 5 green balls in a bag. What is the probability that the first two balls taken from the bag are red balls? (Step 1) (Step 2)
By Hypergeometric Distribution (35) • The first n branches of the tree: x • Total number of clusters: x + y • For our tree, suppose n = 14, x = 31, y = 24 Therefore P = 0.00006 = 0.006% • There is a 0.006% probability that the observed distribution of geographic states could occur by chance.
Age of the common Ancestor • The ancestor corresponds to the deepest node of the tree in Fig.3 and is placed at 2.87% on the scale of accumulated sequence differences. Accordingly, the ancestor existed about 166000 ~249000 years ago. • Derived from the study of restriction maps: 140000 ~ 290000 years ago • From mtDNA sequences of a protein-coding region : 172000 yeas ago
Modern Human Origins • The present study strongly support : All the mtDNAs found in contemporary human population stem from a single ancestral mtDNA that was present in an African population approximately 150,000-200,000 years ago. • The mtDNA evidence is thus consistent with : The last 200,000 years, with subsequent migrations out of Africa that established human populations in Eurasia. • Some proponents of fossil view claim : There has been genetic continuity between modern and archaic Eurasian populations. (10, 48)
Neanderthal, Cro-Magnon and modern Low forehead, prominent eyebrow ridges Very similar to us
Paleolithic Cave Art from Lascaux (Dordogne, France) (About 17000 Ya)
Conclusions • Our study strongly supports the placement of our common mtDNA ancestor in Africa some 200,000 years ago. • mtDNA is but a single genetic locus. There are other locuses such as Y chromosome and other DNA markers, which suggest that a human (male) ancestor exists in Africa 100,000 years ago.
Early globin gene Orthologous or paralogous homologs Gene Duplication -chain gene ß-chain gene mouse human cattle cattle ß human ß mouse ß Orthologs () Orthologs (ß) Paralogs (cattle) Homologs Orthologs – diverged after speciation – tend to have similar function Paralogs – diverged after gene duplication – some functional divergence occurs Therefore, for linking similar genes between species, or performing “annotation transfer”, identify orthologs
How reliable is a result? • Non-parametric bootstrapping • analysis of a sample of (eg. 100 or 1000) randomly perturbed data sets. • perturbation: random resampling with replacement, (some characters are represented more than once, some appear once, and some are deleted) • perturbed data analysed like real data • number of times that each grouping of species/genes/proteins appears in the resulting profile of cladograms is taken as an index of relative support for that grouping
Bootstrapping phylogenies • Characters are resampled with replacement to create many bootstrap replicate data sets • Each bootstrap replicate data set is analysed (e.g. with parsimony, distance, ML etc.) • Agreement among the resulting trees is summarized with a majority-rule consensus tree • Frequencies of occurrence of groups, bootstrap proportions (BPs), are a measure of support for those groups
Example • Imagine a character with two states, present (1) and absent (0) • Imagine a tree with 3 species • Ancestral State is 0 and it can evolve to 1, but not reverse • There are 4 branches, 2 are long (high chance changes in trait) 2 are short (low chance for changes in trait)