Download
1 / 24
240 likes | 398 Vues
Pan-STARRS: Learning to Ride the Data Tsunami. María A. Nieto-Santisteban 1 ,

E N D
Pan-STARRS:Learning to Ride the Data Tsunami MaríaA. Nieto-Santisteban1, Yogesh Simmhan3, Roger Barga3, Tamas Budávari1, László Dobos1, Nolan Li1, Jim Heasley2, Conrad Holmberg2, Michael Shipway1, Alexander Szalay1, Ani Thakar1, Michael Thomassy4, Jan vandenBerg1, Catharine van Ingen3 , Suzanne Werner1, Richard Wilton1,Alainna Wonders1 1. Johns Hopkins University 2. University of Hawaii 3. Microsoft Research 4. Microsoft SQL Server CAT Microsoft eScienceWorkshop, December8th 2008, Indianapolis, IN, U.S.A.
Agenda • GrayWulf • Software Architecture • Pan-STARRS • Riding the Data Tsunami María Nieto Santisteban, 2008 Microsoft eScienceWorkshop
Motivation • Nature of Scientific Computing is changing CPU cycles/s IO/s • Data storage and datasets grow faster than Moore’s Law • Computation must be moved to the data, as the data cannot be moved to the computation • Scientific community is in need of scalable solutions for data intensive computing María Nieto Santisteban, 2008 Microsoft eScienceWorkshop
Requirements CHEAP! María Nieto Santisteban, 2008 Microsoft eScienceWorkshop
Requirements CHEAP! • Scalability • Ability to grow & evolve over time • Performance • Fault tolerance and recovery • Easy to operate • Easy to use • Easy to share María Nieto Santisteban, 2008 Microsoft eScienceWorkshop
GrayWulf (Gray) Database & HPC technologies (Wulf) on commodity hardware SDSS DR1 1TB! Jim, Peter, Alex, and Maria Super Computing 2003 María Nieto Santisteban, 2008 Microsoft eScienceWorkshop
Architecture María Nieto Santisteban, 2008 Microsoft eScienceWorkshop
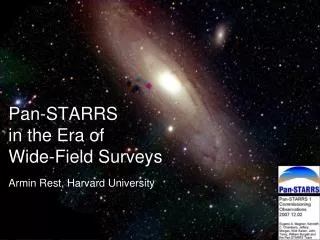
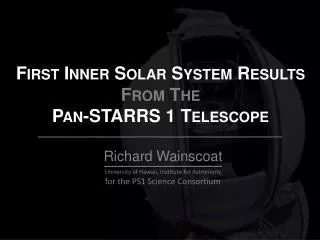
Pan-STARRSPanoramic Survey Telescope and Rapid Response System • Primary goal: • Discover and characterize Earth-approaching objects, both steroids and comets that might pose a danger to our planet • Collected data is rich in scientific value and will be used for Solar System and Cosmology studies M51, The Whirlpool Galaxy, as imaged by the central 4 OTAs in the PS1 camera Comet Holmes, GPC1 camera in the PS1 telescope PS1 telescope Haleakala (Maui)
Pan-STARRS PS1 • Digital map of the sky in 5 colors • CCD mosaic = 1.4 gigapixels • 2/3 of the sky, 3 times per month • Starts at end of 2008, and will run for 3.5 yrs • Data Volume • >1 PB / year of raw image data (2.5 TB/night) • 5.5 e9 celestial objects • 350 e9 detections • ~100 TB SQL Server database built at JHU (PSPS-ODM) • 3 copies for performance, fault tolerance, and recovery 300 TB, the largest astronomy db in the world! • Operated by the Pan-STARRS Science Consortium (PS1SC) • Hawaii + JHU + Harvard/CfA + Edinburgh/Durham/Belfast + Max Planck Society Raw image of Comet Holmes taken with the GPC1 camera early in the commissioning of the PS1 telescope María Nieto Santisteban, 2008 Microsoft eScienceWorkshop
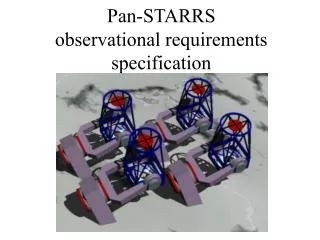
Pan-STARRS PS4 • PS1 is phase 1 • PS4: 4 identical telescopes in year 2012 • 4 PB / year in image data • 400 TB / year into a database PS4 Enclosure concept María Nieto Santisteban, 2008 Microsoft eScienceWorkshop
Other SW Clients DRL WBI IPP MOPS Human Other DM Pan-STARRS System Architecture ODM SSDM María Nieto Santisteban, 2008 Microsoft eScienceWorkshop
SDSS/SkyServer • Pioneer in very large data publishing • 470 million web hits in 6 years • 930,000 distinct usersvs 15,000 astronomers • Delivered 50,000 hoursof lectures to high schools • Delivered >100B rows of data • Everything is a power law • Over 2,000 ‘power users’, more than 2000 refereed papers María Nieto Santisteban, 2008 Microsoft eScienceWorkshop
Similarities with SDSS • Strong requirements on Spatial queries • HTM, Zones, Algebra on regions in SQL Server • The “20 queries” design methodology • Queries from PAN-STARSS scientists – the 20 queries sample queries • Two objectives • Find potential holes/issues in schema • Serve as test queries for integrity and performance • Query Manager, PS1 Data Retrieval Layer of the database, MyDB • Astronomers and Scientists get their own Sandbox • Data is available over the internet • Provides a place to share María Nieto Santisteban, 2008 Microsoft eScienceWorkshop
Differences with SDSS • Time dimension • Most regions will be observed multiple times (~60) • Must store and provide access to temporal history for variability studies • Goes deeper and fainter: contains information from co-added images • Loading process • Demanding and sophisticated • Higher data volume to ingest • Must add ~120 million new detections per day • Must provide updated object information monthly (we plan on weekly) • Database size = 100 TB María Nieto Santisteban, 2008 Microsoft eScienceWorkshop
Pan-STARRS PS1 - monolothic Sizes are in TB María Nieto Santisteban, 2008 Microsoft eScienceWorkshop
Distributed Architecture • The bigger tables are spatially distributed across servers called Slices • Using slices improves system scalability • Spatial information is embedded in ObjectID • Tables are sliced into ranges of ObjectID, which correspond to broad declination ranges • ObjectID boundaries are selected so that each slice has a similar number of objects • Distributed Partitioned Views “glue” the data together María Nieto Santisteban, 2008 Microsoft eScienceWorkshop
Design decisions • Objects are distributed across slices • Objects, and metadata tables are duplicated in the slices to provide parallelization of queries, and facilitate recovery • Detections belong into their object’s slice • Orphans belong to the slice where their position would allocate them • Orphans near slices’ boundaries will need special treatment • Objects keep their original object identifier • Even though positional refinement might change their objectID María Nieto Santisteban, 2008 Microsoft eScienceWorkshop
[Objects_s1] [Detections_s1] Meta P_S1 P_sm [Objects_sm] [Detections_sm] Meta PS1 Objects Detections Meta PS1 database Pan-STARRS Cluster Manager (CSM) Workflow Manager (WFM) Perf. Monitor Linked Servers Query Manager (QM) Legend Database Full table [Sliced_table] Partitioned View DRL Web Based Interface (WBI) María Nieto Santisteban, 2008 Microsoft eScienceWorkshop
Partitioning • Objects and Detections are partitioned by ObjectID • Object partitions in main server correspond to whole slices Linked servers S1 Sm PS1 PS1 database Query Manager (QM) Web Based Interface (WBI)
Layered Architecture • Layer 0 • Staging servers • Data transformation • Layer 1 • Loading/Merger servers • Scrubbing, loading, merging, … • Layer 2 • Slice and Head servers • User queries • Layer 3 • Admin, Query Manager, and MyDBs servers • Workflows, Cluster management, user databases, … María Nieto Santisteban, 2008 Microsoft eScienceWorkshop
The Cold, the Hot, and the Warm Fits Fits Staging 1 Staging 2 Fits Fits Fitsn Fits1 csv csv csv csv csv csv csv csv csv csv csv csv csv csv csv csv csv csv LM1 LM2 LM3 LM4 LM5 LM6 s 1 s 2 s 3 s 4 s 5 s 6 s 7 s 8 s 9 s 10 s 11 s 12 s 13 s 14 s 15 s 16 S2 S3 S4 S5 S6 S7 S8 s 1 s 2 s 3 s 4 s 5 s 6 s 7 s 8 s 9 s 10 s 11 s 12 s 13 s 14 s 15 s 16 s 16 s 3 s 2 s 5 s 4 s 7 s 6 s 9 s 8 s 11 s 10 s 13 s 12 s 15 s 14 s 1 IPP DX L0 ODM L1 S1 L2
Pan-STARRS Layer 2 H1 PS1 H2 PS1 S1 S2 S3 S4 S5 S6 S7 S8 s 1 s 2 s 3 s 4 s 5 s 6 s 7 s 8 s 9 s 10 s 11 s 12 s 13 s 14 s 15 s 16 s 16 s 3 s 2 s 5 s 4 s 7 s 6 s 9 s 8 s 11 s 10 s 13 s 12 s 15 s 14 s 1 María Nieto Santisteban, 2008 Microsoft eScienceWorkshop 22
Pan-STARRS Object Data Manager Subsystem System Operation UI System Health Monitor UI Query Performance UI Data Flow Control Flow System & Administration Workflows Orchestrates all cluster changes, such as, data loading, or fault tolerance Configuration, Health & Performance Monitoring Cluster deployment and operations Pan-STARRS Cloud Services for Astronomers MSR Trident Scientific Workbench Tools for supporting workflow authoring and execution Loaded Astronomy Databases ~70TB Transfer/Week Deployed Astronomy Databases ~70TB Storage/Year Query Manager Science queries and MyDB for results Pan-STARRS Telescope Image Processing Pipeline Extracts objects like stars and galaxies from telescope images ~1TB Input/Week María Nieto Santisteban, 2008 Microsoft eScienceWorkshop 23
Conclusion • Pan-STARRS PS1 database will be ~20 times bigger than Sloan Sky Server (SDSS); 10 year project in 10 days • Distributed solution required - the monolithic solution will not work • Highly scalable distributed database system has been designed to take advantage of current SQL Server 2008 capabilities, Windows Workflow Foundation , Windows HPC, and Trident • Moore’s Law & exponential data growth - Petabytes/year by 2010 • Need scalable solutions, Move analysis to the data, Spatial and temporal features essential • Same thing happening in all sciences • High energy physics, genomics, cancer research,medical imaging, oceanography, remote sensing, … • Application of Pan-STARRS Pattern – 100+TB common María Nieto Santisteban, 2008 Microsoft eScienceWorkshop