Download
1 / 47
470 likes | 589 Vues
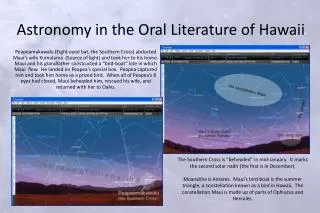
Configuring the Pan-STARRS Optics - From Simulations to Operational Control System. Nick Kaiser Pan-STARRS, Institute for Astronomy, U. Hawaii Following the Photons Edinburgh, Oct 10, 2011. Pan-STARRS PS4 Observatory. Haleakala Observatories, Maui, HI. Introduction.

E N D
Configuring the Pan-STARRS Optics - From Simulations to Operational Control System Nick Kaiser Pan-STARRS, Institute for Astronomy, U. Hawaii Following the Photons Edinburgh, Oct 10, 2011
Introduction • The Pan-STARRS telescope has to deliver sub-arc-second images over a 3-degree diameter field of view • It has 2 mirrors, 3 lenses (several highly aspheric surfaces) and a focal plane • alt-az design with L3 and the camera behind the instrument rotator • That gives 5x5 + 3 - 1= 27 degrees of freedom (tilts, decenters and despaces) • to be adjusted to get all of the elements collimated and aligned with the rotator axis • Required precision is ~tens of micron • In addition, the primary mirror support system has 12 independently controllable pneumatic axial supports • total of 39 d.o.f. to be controlled
How do we configure the PS optics? • Advice from experts… not encouraging • Too many parameters • What about “degeneracies”? • Won’t you get stuck in a local minimum? • Or crawl along a valley? • Discouraging lessons from megaprime… • Try to “divide and conquer”? • Problem: M1/M2 system alone does not deliver images even on axis • M1/M2 system has real-time control of all d.o.f • Approach adopted (evolved) • 1) Solve 8 d.o.f problem of M1, M2 relative to L1+L2 • L1+L2 assembled at UW on turntable quite accurately • 2) Then fix any tilt of detector plane • L3 (dewar window) is relatively weak • Rotator allows this to be determined separately from any tilt introduced by M1+M2+L1+L2 system
Initial configuration: • Plan: use auto-reflecting telescope • Mounted on a jig on the back of the telescope • Aligned with rotator axis • Used to align other elements with targets (M2) and fiducial marks (lenses) • First light (07/2007) gave ~10” IQ • Adjusting mirrors iteratively gave ~2” IQ • Field curvature and field dependent astigmatism diagnosed • Attributed to L1, L2 de-space • But still IQ was not adequate • Exploring 8 parameter M1, M2 til + decenter parameter space infeasible • Needed a more methodical approach
Aberration diagnosis techniques • Traditional wave-front sensing approaches: • Shack-Hartmann imaging • Implemented in PS GPC1 as deployable probe • Hartman mask imaging • Knife-edge test • Rotational beam-shearing interferometry • Claude Roddier thesis • Other probes • Ghost image analysis • Direct (e.g. laser) metrology • Analysis of in-focus images • Highly non-linear dependence on positional d.o.fs • Too hard to explore big parameter space • Technique adopted: • Use M2 de-space to generate out-of-focus (a.k.a. donut) images • Thousands of stars per exposure => huge amount of information • At large enough defocus shapes become linearly dependent on misconfiguration parameters (like weak-lensing)
Wavefront Aberrations from Out-of-Focus Images • Perfectly collimated (and designed) telescope gives donut images when defocused that are • Uniformly bright • Circularly symmetric • annular because of hole in primary • At large-enough defocus these are well described by geometric optics (images formed by “rays”) • Any aberrations (displacement of elements or figure errors) deflect rays and cause distortion of the shape of the out-of-focus image • Crowding or dilution of the density of rays modulated brightness a la Roddier (1990) • Brightness proportional to curvature (Laplacian) of converging wave-front aberration. • Hence “curvature sensing” • Pioneered by Roddier group at IfA for Adaptive Optics
Illustration of the effect of a localized aberration on out-of-focus images
Advantages: Linearity and Multiplexing • Donut shape statistics are a linear response to causes of aberrations • Linearity breaks down too close to focus. • Shadowing and flat fielding etc. become problematic too far from focus. • `Sweet spot' seems to be around 3mm defocus • may be possible to go closer for more sensitivity • But may require `physical optics' modelling • Solve a set of linear equations to find mirror displacements and actuator commands to cancel aberration • No iteration (in principal) - one step solution • No local minima - finds unique global minumum • Massively multiplexed - thousands of stars per image
Separating Seeing and Mirror Wobbling from Aberrations • We want to obtain sub-seeing aberrations. • But seeing causes wavefront errors of many radians of phase • Causes donuts to wobble around like jello. • Averages out in long exposures • But leads to smearing. • Worse still, mirror oscillations will produce persistent anisotropies • Fortunately, such affects can be readily distinguished by using both pre- and post-focus image pairs.
Symmetries Between Pre- and Post-Focus Image Statistics 1) Focus aberration
Symmetries Between Pre- and Post-Focus Image Statistics2) Comatic (cos phi) aberration
Symmetries Between Pre- and Post-Focus Image Statistics 3) Astigmatic (cos 2 phi) aberration
Symmetries and anti-symmetries • Even angular harmonic change sign passing through focus, while the odd harmonics do not • If we rotate the post focus images by 180 degrees the sign always changes • This is the characteristic of wave-front phase errors • But wavefront amplitude errors have opposite symmetry • Easily distinguished • Can construct combinations of pre- and post focus image statistics that are blind to effects of telescope wobble, obscurations etc.
What about “degeneracies”? • `Degeneracy' here means combinations of displacements that do not cause any measurable aberration • Terminology is sloppy: Technically, `degeneracy' means non-distinct eigenvalues • Here all decenter/tilts are degenerate in the proper sense. • `Quasi-degeneracy' arises if there are combinations that produce almost zero measurable effect. • These cause the linear equation solution (inversion of matrix) to be singular or ill conditioned. • Example: An exact degeneracy arises because IQ only depends on relative positioning of optical elements • But is easy to deal with • Quasi-degeneracies are a little more tricky.
Dealing with quasi-degeneracies • Example: decenters and/or tilts of M1 nearly degenerate with decenter of M2 • Similar degeneracies for L3/focal-plane system • But quasi-degeneracies are not to be feared; they are our friends • Can be identified using elementary linear algebraic techniques • They allow one to correct for one misalignment that is difficult to cure by moving another element or combination of elements that are easier • Fundamental to Pan-STARRS design • real-time control over the configuration of the mirrors • but not of the other elements -- which will surely flex/expand etc
Donut finding/analysis pipeline • The goal is to obtain, from an out of focus gigapixel camera image, a grid of donuts covering the focal plane. • Step 1: Determine the size of the donuts • Generate cleaned log-scaled image • Compute the autocorrelation function • Cross-correlate with theoretical model in log(r) space • Step 2: Determine location of the donuts • Generate an analytic model for the 2-D donut image. • Construct a regularized deconvolution filter • Apply to image to obtain the locations of candidate donuts • Filter candidates catalog to obtain tens of good donuts per OTA • Step 3: Generate robust (median) average • Candidates include some overlaps, cell boundaries etc. • Take median to get clean donut image • Result is a grid of 60 donuts per focal plane
Donut shape statistics • We need to quantify the distortion of donuts and how this varies across the field. • What is a good set of statistics? • It is traditional to use Zernike polynomials • see Knoll, JOSA 66, p207 • We use something similar: angular Fourier expansion of radius, width and brightness of donuts • We first compute the centroid of the light in a postage stamp containing the donut • From the pixel locations, relative to the centroid, we define a radius r and azimuthal angle • Compute moments of donut radius, width and brightness • Typically cos 2, cos 3, cos 4 theta modes • Exploit symmetries in pre- and post-focus images to generate combined statistic that is independent of actual focus • Results in ~100 statistics for each of ~60 donuts across the focal plane.
PS1 IQ – Smallest Image Median FWHM to Date NK FWHM = 0.69", JT FWHM = 0.63 q = measure of circularity of 2D PSF 39 UNIVERSITY OF HAWAII INSTITUTE FOR ASTRONOMY Project Proprietary Data – For Internal Use Only
PS1 3pi survey – 15 to 20 images in five bands,building astrometric catalog for re-processing