Download
1 / 2
Understanding the Role of R^2 in Regression Analysis
20 likes | 110 Vues
Uncover how R^2 enhances predictive accuracy in regression models compared to using the mean. Learn the significance of SSE differences and how they affect your projections, with a focus on interpreting R^2 values effectively.
Télécharger la présentation 
Understanding the Role of R^2 in Regression Analysis
An Image/Link below is provided (as is) to download presentation
Download Policy: Content on the Website is provided to you AS IS for your information and personal use and may not be sold / licensed / shared on other websites without getting consent from its author.
Content is provided to you AS IS for your information and personal use only.
Download presentation by click this link.
While downloading, if for some reason you are not able to download a presentation, the publisher may have deleted the file from their server.
During download, if you can't get a presentation, the file might be deleted by the publisher.
E N D
Presentation Transcript
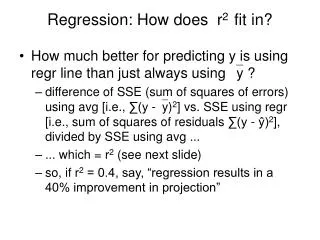
Regression: How does r2 fit in? • How much better for predicting y is using regr line than just always using y ? • difference of SSE (sum of squares of errors) using avg [i.e., ∑(y -y)2] vs. SSE using regr [i.e., sum of squares of residuals ∑(y - ŷ)2], divided by SSE using avg ... • ... which = r2 (see next slide) • so, if r2 = 0.4, say, “regression results in a 40% improvement in projection”


More Related