Download
1 / 16
170 likes | 300 Vues
This presentation outlines the process of enhancing inventory cost management through the Economic Order Quantity (EOQ) model. With a focus on A-class inventory items at a specific store, we analyze historical data to demonstrate the significant cost-saving potential of EOQ. Key topics include problem overview, data description, Pareto analysis, calculation of current vs. EOQ inventory costs, and additional recommendations for maintaining inventory accuracy. Our findings reveal potential annual savings exceeding $2 million across stores, emphasizing the critical role of effective inventory management.

E N D
Mark Mastrangeli John Knezevic Improving Inventory Costs with EOQ
Agenda: • Problem Overview • Data Description & Data Sample • Assumptions(carrying, holding costs) • Pareto Analysis (ABC Classification) • EOQ Models • Sample Savings • Other Recommendations
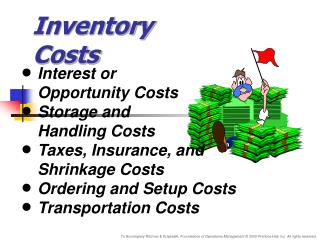
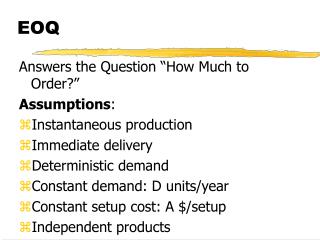
Overview • Objectives Of Inventory Management • Minimize Inventory Costs • Maximize Customer Service • In order to Minimize Inventory Cost • Find Economic Order Quantity that minimizes: • Annual Ordering Cost + Annual Carrying Cost • Annual Purchasing Cost is not included because there is nothing you can do about it.
Data Description • Given 2.9 million line historical data file • Focusing on a single store’s A class inventory Items we calculated: • Current Method Annual Inventory Cost • EOQ Annual Inventory Cost • ~3000 Item Master Inventory spreadsheet • Eliminated Many Items to narrow inventory
Relevant Data • Item No • Location • Item Description • Item Price • Average Cost • Max Order • Lead Time
Assumptions • 350 Day Working Year • $10.00 Cost per Order • 7% IRR Carrying Cost • Max Order Quantity could be changed
Pareto Analysis (ABC Classification) • Pareto Principle • 80% of a nation’s wealth, owned by 20% of population • Apply concept to inventory • A - account for 10-20% of items, 60-80% value • B - account for 20-40% of items, 15-30% value • C - account for 50-60% of items, 5-10% value • Focused exclusively on A items
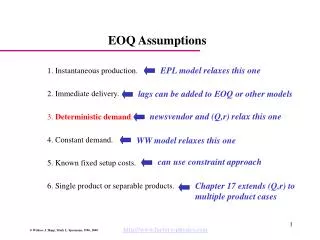
The Basic EOQ Model • Can be used in planning the purchases of inventory items for retailers • General Assumptions: • Uses Constant Annual Demand vs. Fluctuating Periodic • Item’s purchase cost is independent of the quantity ordered and irrelevant in calculating annual inventory cost • Lead time is a certainty
Our Analysis: • Assuming, • Max Order Quantity has been changed. • $10.00 Cost per Order • 7% IRR • 350 Working Days per year • Calculated Cost of Actual known orders • Averaging Total Units Ordered over Duration and known number of orders • Calculated EOQ Model for all 27 Class ‘A’ Items
Sample Savings • For All 27 Class ‘A’ Items • Current Total Cost of Inventory under given assumptions: $3,315.91 • EOQ Total Cost of Inventory: $1348.05 • Savings over current method: $1967.86 • Average Savings per Item: $72.88 • ~Annual Savings for All 1124 stores: • 1124 x $1967.86 = $2,211,874.64 • If Pareto Principle Holds $2,211,874.64 = 60% Value • Then 100% = $ 3,686,461.69
Other Findings: • For 3227 Orders, 516 Items in the history for Greenville, Dallas Center Avg Units per order = 2.7 • Under EOQ for 27 A Items 67 Orders per year • Under Current Method 307 Orders per year • 80% Reduction • 80% Reduction of 3227 = 645 Orders
Recommendations: • Maintaining Inventory Accuracy • Avoid stock outs at all cost • DC does not have item to send • Recommended levels of accuracy • A items ± 0.2% • B items ± 1% • C items ± 5% • Cycle Counting • Each month 1/12th of company items are counted • Consider Changing Max Order Quantity and Using EOQ