Inventory Analysis under Uncertainty: Lecture 6
230 likes | 407 Vues
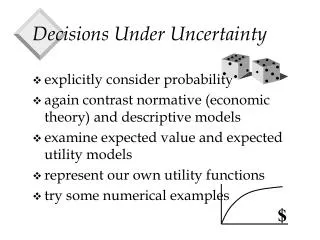
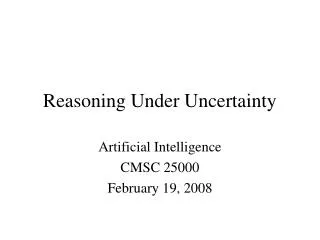
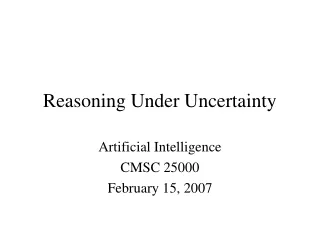
Inventory Analysis under Uncertainty: Lecture 6. Leadtime and reorder point Uncertainty and its impact Safety stock and service level Cycle inventory, safety inventory, and pipeline inventory. Leadtime and Reorder Point. Q. Usage rate R. Inventory level. Average inventory = Q /2.

Inventory Analysis under Uncertainty: Lecture 6
E N D
Presentation Transcript
Inventory Analysis under Uncertainty: Lecture 6 • Leadtime and reorder point • Uncertainty and its impact • Safety stock and service level • Cycle inventory, safety inventory, and pipeline inventory
Leadtime and Reorder Point Q Usage rate R Inventory level Average inventory = Q/2 Reorder point Time Place order Place order Receive order Receive order Receive order
ROP (reorder point): inventory level which triggers the placing of a new order Example: R = 20 units/day with certainty Q*= 200 units L= leadtime with certainty μ =LR= leadtime demand Average inventory = cycle inventory When to Order? 0 2 7 14 22
Uncertain Leadtime Demands • Sandy is in charge of inventory control and ordering at Broadway Electronics • The leadtime for its best-sales battery is one week fixed • Sandy needs to decide when to order, i.e., with how many boxes of batteries left on-hand, should he place an order for another batch of new stock • How different is this from Mr. Chan’s task at Motorola?
Forecast and Leadtime Demand • Often we forecast demand and stock goods accordingly so that customers can be satisfied from on-hand stock on their arrivals • But it is impossible to forecast accurately, especially for short time periods, i.e., we may have a good estimate for the total demand in a year, but the leadtime (2 weeks) demand can be highly uncertain • A further problem is the uncertainty of the length of the leadtime
When you place an order, you expect the remaining stock to cover all leadtime demands Any new order can only be used to satisfy demands after L When to order? Stockout Risk Inventory on hand order ROP1 ROP2 L
ROP under Uncertainty • When DL isuncertain, it always makes sense to order a little earlier, i.e., with more on-hand stock • ROP = + IS where • IS=safety stock = extra inventory
Safety Stock and Service Level Determining ROP is equivalent to determining the safety stock Service level SL or β Service level is a measure of the degree of stockout protection provided by a given amount of safety inventory Or the probability that all customer demands in the leadtime are satisfied immediately
Example, Broadway The weekly demand for batteries at Broadway varies. The average demand is estimated to be 1000 units per week with a standard deviation of 250 units The replenishment leadtime from the suppliers is 1 week and Broadway orders a 2-week supply whenever the inventory level drops to 1200 units. What is the service level provided with this ROP? What is the average inventory level?
Solution Using the Normal Table • Average weekly demand µ = 1000 • Demand SD = 250 • ROP = 1200 • Safety stock • Safety factor • Service Level: β =SL = Prob.(LD ≤ 1200) Use normal table =
Computing the Service Level Mean: µ= 1000 SL = Pr (LD ROP) = probability of meeting all demand (no stocking out in a cycle)
Safety Stock for Target SL If Sandy wants to provide an 85% service level to the store, what should be the reorder point and safety stock? Solution: from the normal table z0.85 = ROP = Safety stock = Is=
Using Excel • Solve Pr(DL ROP) = SL for ROP • If DL is normally distributed • zβ= NormSInv(SL), ROP = + zβσ = + NormSInv( SL)·σ = Or = NormInv( SL, ,σ)= • For givenROP SL =Pr(LT Demand ROP) =NormDist( ROP, , σ, True) = Spreadsheet
Price of High Service Level NormSInv ( 0.99)·200 0.5 0.6 0.7 0.8 0.9 1.0 NormSInv ( 0.95)·200 NormSInv ( 0.9)·200 Safety Inventory NormSInv ( 0.8)·200 NormSInv ( 0.7)·200 NormSInv ( 0.6)·200 NormSInv ( 0.5)·200 Service Level Spreadsheet
Reducing Safety Stock Levers to reduce safety stock - Reduce demand variability - Reduce delivery leadtime - Reduce variability in delivery leadtime - Risk pooling
Demand Aggregation • By probability theory Var(D1 + …+ Dn) = Var(D1) + …+ Var(Dn) = nσ2 • As a result, the standard deviation of the aggregated demand
The Square Root Rule Again • We call (3) the square root rule: • For BMW Guangdong • Monthly demand at each outlet is normal with mean 25 and standard deviation 5. • Replenishment leadtime is 2 months. The service level used at each outlet is 0.90 • The SD of the leadtime demand at each outlet of our dealer problem • The leadtime demand uncertainty level of the aggregated inventory system
Cost of Safety Stock at Each Outlet • The safety stock level at each outlet is Is = • The monthly safety stock holding cost TC(Is) =
L Safety Inventory Level Inventory on hand Q order order order ROP mean demand during supply lead time safety stock Time t L Leadtime
Saving in Safety Stock from Pooling • System-wide safety stock holding cost withoutpooling • System-wide safety stock holding cost with pooling Annual saving =
Pipeline Inventory • If you own the goods in transit from the supplier to you (FOB or pay at order), you have a pipeline inventory • On average, it equals the demand rate times the transit time or leadtime by Little’s Law • Your average inventory includes three parts Average Inventory = =
Examples • Sandy’s average inventory with SL=0.85: Q=2000, L =1 week, R = 1000/week Average inventory: • BMW’s consolidated average inventory with SL = 0.9: L = 2, Q = 36 (using EOQ), R=100/month Average inventory:
Takeaways • ROP = + IS = RL + zβσ • Leadtime demand: = RL and std • Assuming demand is normally distributed: • For given target SL ROP = + zβσ = NormInv(SL, ,σ) = +NormSInv(SL)·σ • For given ROP SL = Pr(DL ROP) = NormDist(ROP, , σ, True) • Safety stock pooling (of n identical locations) • Average inventory = Q/2 + zβσ Do not own pipeline = Q/2 + zβσ+RL Own pipeline