Decisions under Uncertainty
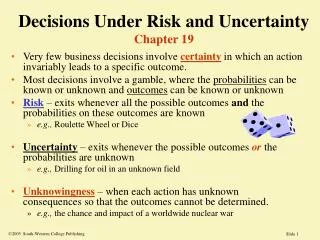
Decisions under Uncertainty. Our Main Question. How individuals behave when they are dealing with uncertainty?. The Approach. Goal: Develop the theory of investor choice with a few ingredients: A) 5 axioms of rational choice under uncertainty

Decisions under Uncertainty
E N D
Presentation Transcript
Our Main Question • How individuals behave when they are dealing with uncertainty?
The Approach • Goal: Develop the theory of investor choice with a few ingredients: • A) 5 axioms of rational choice under uncertainty • By-Product: Expected Utility Theorem to measure utility in the presence of risk. • B) Assumption of non-satiation (i.e., greed) • C) Risk-aversion • D) Measuring the objects of choice (i.e., the assets that investors invest) using Mean and Variance of asset return. • D) Mapping trade-offs between Mean and Variance that provides indifference curves of investors. • such trade-off reveals an investor’s degree of risk-aversion.
The End-product • By the end of this lecture, we will be able to formulate the following diagram of individual investor’s indifference curves. Returns EU2 EU1 Where EU2 >EU1 Message: [i] For the same level of risk, everyone prefers higher returns. [ii] For the same level of returns, everyone prefers lower risk. Risk
Why care about uncertainty? Simple answer: Because in reality, almost every decision we make involves uncertainty. • Example: • Uncertainty from product quality. (e.g., used vehicle, order food before eating, any durable goods consumption) • Uncertainty in dealing with others. (e.g., marriage, firm’s cutting price may or may not induce price war) • Purchase of financial assets (stocks, bonds, exchange rate changes, etc.) • its returndepends on the future. This is the essence of Financial Economics
An example to motivate Expected utility theory says: • When payoffs in the next period are uncertain, every individual has his unique utility function to describe his own preference. • With such utility function & GREED, individuals make the following decision: • Max [Expected utility of wealth] subject to his constraints. • Question: Suppose in this period, Robert can decide to hold either Asset i or Asset j which both pays off in next period. This is his constraint. In the next period, Asset i pays him $10 with probability of 0.4 and $2 with probability of 0.6. Asset j pays him $8 with probability of 0.3 and $3 with probability of 0.7. • Answer: He chooses to hold the asset that gives him the highest expected utility of wealth, but NOT the highest expected wealth. $10 0.4 E(W) = 0.4(10) + 0.6(2) = 5.2 Asset i E[U(W)] = 0.4U(10) + 0.6U(2) = ? 0.6 $2 He would choose the asset that gives him highest E[U(W)] $8 0.3 E(W) = 0.3(8) + 0.7(3) = 4.5 Asset j E[U(W)] = 0.3U(8) + 0.7U(3) = ? 0.7 $4
St. Petersburg Paradox • What measure happiness? To convince you that is NOT E(W), let’s consider the following famous paradox. “Suppose someone offers to toss a fair coin repeatedly until it comes up heads, and to pay you $1 if this happens on the first toss, $2 if it takes two tosses to land a head, $4 if it takes three tosses, $8 if it takes four tosses, etc. What is the largest sure gain you would be willing to forgo in order to undertake a single play of this game?” • The table illustrates only 3 possible states, whereas theoretically, you can construct this table infinitely. The point is, the Expected wealth (i.e, E(W)) if we play this gamble is infinite if the cost of playing it is finite. Again, the expected payoff of this gamble is ∞ given finite playing cost. • You may probably pay $2, or even $10 to play this gamble, depending on your risk-preference. But you would probably not pay $1,000 to play. The point is, no one on earth would pay any amount close to the expected payoff of this gamble to play. • Why? Because we are not maximizing our E(W), but E(U(W)). It is really the E(U(W)) that measures our level of happiness.
Rational decision theory • To develop a theory of rational decision making under uncertainty, we impose some precise yet reasonable axioms about an individual’s behavior. • We assume 5 axioms of cardinal utility. • Axiom 1: Comparability (a.k.a., completeness) • Axiom 2: Transitivity (a.k.a., consistency) • Axiom 3: Strong independence • Axiom 4: Measurability • Axiom 5: Ranking • What do these axioms of generally mean? • all individuals are assumed to make completely rational decisions (reasonable) • people are assumed to make these rational decisions among thousandsof alternatives (hard) • CONCERNING C49: • The following 4 pages of slides explain each axiom in full details. You may skip them because I would not test you more than remembering their names. However, they don’t seem as hard as they sounds. I will go through each of them with an example in class. • Believe it or not, it is just these 5 rules, we establish the expected utility theory. The derivation is mathematical and I will neither go through it nor test it. If you are interested, Chapter 3 section B is what you should read. • With one more assumption, i.e, people are greedy, we get what we want, i.e., individual maximizing their expected utility of wealth (i.e., Max E(U(W)) subject to constraints)
5 Axioms of Choice under uncertainty A1.Comparability (also known as completeness). For the entire set, S, of uncertain alternatives, an individual can say that either outcome x is preferred to outcome y (x › y) or y is preferred to x (y › x) or indifferent between x and y (x ~ y). A2.Transitivity (also known as consistency). If an individual prefers x to y and y to z, then x is preferred to z. If (x›y and y›z, then x›z). Similarly, if an individual is indifferent between x and y and is also indifferent between y and z, then the individual is indifferent between x and z. If (x ~ y and y ~ z, then x ~ z).
5 Axioms of Choice under uncertainty A3.Strong Independence. Suppose we construct a gamble where the individual has a probability α of receiving outcome x and a probability (1-α) of receiving outcome z. This gamble is written as: G(x,z:α) Strong independence says that if the individual is indifferent to x and y, then he will also be indifferent as to a first gamble, set up between x with probability α and a mutually exclusive outcome z, and a second gamble set up between y with probability α and the same mutually exclusive outcome z. If x ~ y, then G(x,z:α) ~ G(y,z:α) NOTE: The mutual exclusiveness of the third outcome z is critical to the axiom of strong independence.
5 Axioms of Choice under uncertainty A4.Measurability. (concerning about CARDINAL UTILITY) If outcome y is less preferred than x(y ‹ x) but more than z(y › z), then there is a unique probability α such that: the individual will be indifferent between [1] y and [2] A gamble between x with probability α z with probability (1-α). In Math: if x › y > z or x > y › z , then there exists a unique probability α such that y ~ G(x,z:α)
5 Axioms of Choice under uncertainty A5.Ranking. (CARDINAL UTILITY) If alternatives y and u both lie somewhere between x and z and we can establish gambles such that an individual is indifferent between y and a gamble between x (with probability αy) and z, while also indifferent between u and a second gamble, this time between x (with probability αu) and z, then if αy is greater than αz, y is preferred to u. If x > y > z and x > u > z then by axiom 4, we have y ~ G(x,z:αy) and u ~ G(x,z:αz), then it follows that if αy > αz then y › u, or if αy = αz , then y ~ u
Derivation of Expected utility theory Question: How do individuals rank various combinations of risky alternatives? • The derivation, one of the most elegant inductive proofs of human knowledge, uses the axioms to show how preferences can be mapped into measurable utility. • That means, I can in principle tell exactly that risky asset i gives me EUi unit of expected utility, and EUj for risky asset j. By comparing EUi and EUj, I can claim whether I prefer i to j, or j to i, or indifferent between them. • In the end, expected utility theory shows that the correct ranking function for risky alternatives is the expected utility. • Example again: If risky asset j gives random payoff in the next period: $10 with probability 0.5, $5 with probability 0.2, and $-10 with probability 0.3. Then I evaluate j as E(U(W)) = ∑i [(Prob. of state i) x (payoffs in state i)] = 0.5x(U(10)) + 0.2x(U(5)) + 0.3x(U(-10))
Your preference dictates U(W) E(U(W)) = ∑i [(Prob. of state i) x (payoffs in state i)] • With this in mind, we do an exercise to show how your preference constructs your unique utility function. Suppose I arbitrarily assign a utility of -10 to a loss of $1000 and ask the following question: • If you are faced with a gamble with prob. p of winning $1000, and prob. (1-p) of losing $1000. What is this precise p that makes you indifferent between: [i] taking the gamble or [ii] getting $0 with certainty? • In math, we have: U(0) = pU(1000) + (1-p)U(-1000) = pU(1000) + (1-p)(-10) • Assume U(0) = 0 for yourself, and if your answer is that p = 0.6, then, U(1000) = 6.66667. • Repeat this procedure for different payoffs, and you can work out your own utility function. • MESSAGE: The AXIOMS of preference is convertible to a UTILITY fn.
Explaining the St. Petersburg Paradox • Going back to the St. Petersburg Paradox, we explain it with the help of another big big concept: i.e., RISK-AVERSION. • If the utility function that an individual has is marginal utility being always positive (i.e., the greed assumption), and that it has diminishing MU as W increases (i.e., risk-aversion), such as the following utility function: e.g., U(W) = ln(W)U'(W)=1/W > 0MU positive U"(W)=-1/W2 < 0 Diminishing MU Then, E(U(W)) = ∑i [(Prob. of state i) x (payoffs in state i)] = αi ln(Xi) = 1.39 < • Thus, an individual would pay an amount up to 1.39 unitsof expected utility to play this gamble. • Later on, we will define this U(CE) = ln(CE) = 1.39, => CE = 4.01485 as the certainty equivalent.
Preferences to Risk: Intro U(W) U(W) U(W) U(b) U(b) U(a) U(b) U(a) U(a) a b W a b W a b W Risk-loving Risk Neutral Risk Averse U'(W) > 0 U''(W) = 0 U'(W) > 0 U''(W) > 0 U'(W) > 0 U''(W) < 0
Preferences to Risk: Intro U(W) U(W) U(W) U(b) U(b) U(a) U(b) U(a) U(a) a b W a b W a b W Risk-loving Risk Neutral Risk Averse • Goals: • Formally define what is risk-aversion. • Establish the concept of risk-premium
Risk Aversion • Consider the following gamble: • Outcome aprob = α • Outcome bprob = 1-α => G(a,b:α) Question: Will we prefer the expected value of the gamble with certainty, or will we prefer the gamble itself? • ie. consider the gamble with • 10% chance of winning $100 • 90%chance of winning $0 => E(Gamble) = $10 Question: Would you prefer the $10 for sure or would you prefer the gamble? [i] if prefer the gamble, you are risk loving [ii] if indifferent to the options, risk neutral [iii] if prefer the expected value over the gamble, risk averse
Risk-aversion as shown in Utility Fn U(W)=lnW 3.40=U(30) Risk-averse U: Let U(W) = ln(W) U'(W) > 0 U''(W) < 0 U'(W) = 1/w U''(W) = - 1/W2 MU positive But diminishing 2.30=U[E(W)] 1.61=U(5) 0 W 1 5 10 20 30
Risk-aversion as shown in Utility Fn U(W)=lnW 3.40=U(30) Risk-averse U: Let U(W) = ln(W) E[U(W)] =0.8U(5) + 0.2U(30) =0.8(1.61)+0.2(3.4) =1.97 Certainty Equivalent: U(CE) = 1.97 = ln(CE) CE=7.17 2.30=U[E(W)] 1.97=E[U(W)] 1.61=U(5) 0 W 1 5 7.17 10 20 30
U[E(W)] VS E[U(W)] In general, if U[E(W)] > E[U(W)] then risk averse individual if U[E(W)] = E[U(W)] then risk neutral individual if U[E(W)] < E[U(W)] then risk loving individual risk aversion occurs when the utility function is strictly concave risk neutrality occurs when the utility function is linear risk loving occurs when the utility function is convex Certainty Equivalent Definition: The amount of money that the individual needs to hold for certainty in order to be indifferent from playing the gamble. As the example: This person is indifferent between [i] holding $7.17 for certain [ii] playing the gamble that has 80% chance with $5 and 20% with $30.
Markowitz Risk Premium CE’s Definition: The amount of money that the individual needs to hold for certainty in order to be indifferent from playing the gamble. As the example: This person is indifferent between [i] holding $7.17 for certain [ii] playing the gamble that has 80% chance with $5 and 20% with $30. Risk premium: the difference between an individual’s expected wealth, given the gamble, and the certainty equivalent wealth. As the example: This person pays a risk-premium of: RP = E(Gamble) – CE = $10 - $7.17 = $2.83 Meaning: Any insurance that costs less than $2.83 that ensures him the level of wealth of $10 will be attractive to him. Cost of gamble: The difference between an individual’s current wealth and the certainty equivalent wealth.
Risk Premium VS cost of gamble Risk premium: the difference between an individual’s expected wealth, given the gamble, and the certainty equivalent wealth. As the example: This person pays a risk-premium of: RP = E(Gamble) – CE = $10 - $7.17 = $2.83 Meaning: Any insurance that costs less than $2.83 that ensures him the level of wealth of $10 will be attractive to him. Cost of gamble: The difference between an individual’s current wealth and the certainty equivalent wealth. e.g., If the individual’s current wealth is: (a) $10 = E(gamble) Cost of gamble = $10 - $7.17 = $2.83 RP = C of Gamble (b) $11 > E(gamble) Cost of gamble = $11 - $7.17 = $3.83 RP < C of Gamble (c) $9.5 < E(gamble) Cost of gamble = $9.5 - $7.17 = $2.43 RP > C of Gamble NOTE: Risk premium may or may not be the same as Cost of Gamble, depending on current wealth. If you are risk-averse, risk premium is always positive!!!
The Arrow-Pratt Premium • We can have a more solid, or mathematical, definition of premium. • Risk Averse Investors • assume that utility functions are strictly concave and increasing • Individuals always prefer more to less (MU > 0) • Marginal utility of wealth decreases as wealth increases • A More Specific Definition of Risk Aversion • W = Current wealth • Z = Random gamble payoffs, where E(Z) = 0, Variance of Z = σ2z • (W,Z) = Arrow-Pratt Premium • What risk premium (W,Z) must be added to the gamble to make the individual indifferent between the gamble and the expected value of the gamble?
The Arrow-Pratt Premium The risk premium can be defined as the value that satisfies the following equation: E[U(W + Z)] = U[ W + E(Z) - ( W , Z)](*) LHS: RHS: expected utility of utility of the current level of wealth the current level plus of wealth, given the the expected value of gamble the gamble less the risk premium We use a Taylor series expansion to (*) to derive an expression for the risk premium (W,Z).
Absolute Risk Aversion • Arrow-Pratt Measure of a Local Risk Premium (derived from (*) above) • Define ARA as a measure of Absolute Risk Aversion • This is a measure of absolute risk aversion because itmeasures risk aversion for a given level of wealth ARA > 0 for all risk-averse investors (U'>0, U''<0) How does ARA change with an individual's level of wealth? • ie. a $1,000 gamble may be trivial to a rich man, but non-trivial to apoor man => ARA will probably decrease as our wealth increases i.e., ARA ↓ as W ↑
Relative Risk Aversion • Define RRA as a measure of Relative Risk Aversion • Constant RRA => An individual will have constant risk aversion to a "proportional loss" of wealth, even though the absolute loss increases as wealth does. • That is, with a gamble with 50/50 chance of increasing your wealth by 10% or decreasing it by 10%, you are about as risk-averse to such gamble regardless of how wealthy or how poor you are. The risk premium, measured as a percentage of your initial wealth, will stay constant.
E.g.: Quadratic Utility Quadratic Utility - widely used in the academic literature U(W) = a W - b W2 U'(W) = a - 2bW U"(W) = -2b -U"(W) 2b ARA = --------- = --------- U'(W) a -2bW d(ARA) ------- > 0 dW 2b RRA = --------- a/W - 2b d(RRA) ------- > 0 dW quadratic utility exhibits increasing ARA and increasing RRA ie an individual with increasing RRA would become more averse to a given percentage loss in W as W increases - not intuitive
An Example • U=ln(W) W = $20,000 • G(10,-10: 0.5) 50% will win $10, 50% will lose $10 • What is the risk premium associated with this gamble? • Calculate this premium using both the Markowitz and Arrow-Pratt Approaches
Arrow-Pratt Measure • = -(1/2) 2z U''(W)/U'(W) • 2z = 0.5*(20,010 – 20,000)2 + 0.5*(19,090 – 20,000)2 = 100 • U'(W) = (1/W) U''(W) = -1/W2 • U''(W)/U'(W) = -1/W = -1/(20,000) • = -(1/2) 2z U''(W)/U'(W) = -(1/2)(100)(-1/20,000) = $0.0025
Markowitz Approach • E(U(W)) = piU(Wi) • E(U(W)) = (0.5)U(20,010) + 0.5*U(19,990) • E(U(W)) = (0.5)ln(20,010) + 0.5*ln(19,990) • E(U(W)) = 9.903487428 • ln(CE) = 9.903487428 CE = 19,999.9975 • The risk premium RP = $0.0025 • Therefore, the AP and Markowitz premia are the same
Markowitz Approach E(U(W)) = 9.903487 20,010 19,990 20,000 CE
Differences in two approaches • Markowitz premium is an exact measures whereas the AP measure is approximate • AP assumes symmetry payoffs across good or bad states, as well as relatively small payoff changes. • It is not always easy or even possible to invert a utility function, in which case it is easier to calculate the AP measure • The accuracy of the AP measures decreases in the size of the gamble and its degree of asymmetry
E(U) and the end-product Returns = expected return = E(R) EU2 EU1 • Our final step: the bridging of expected utility theory to the indifference curves Risk = standard deviation of return = σR Derivation is from chapter 3 part F. Interested student may consult the text. • The transformation is just the following: Define [i] Wj as the wealth that you will get in next period if you hold asset j. [ii] W0 your current period wealth. Thus, return of holding asset j = Rj = (Wj -W0)/W0 Assume Wi is normally distributed, so Rj is normally distributed too. (Big assumption) NOTE: we simplify by assuming normally distributed returns. So, we can describe a return simply by its mean and standard deviation.
Summary • With 5 axioms, prefer more to less, we have Expected utility theory, where preferences => Utility function. • With risk-aversion assumption, we solve St. Petersburg’s paradox. • Assuming we are all greedy, we know every rational investor will maximize his E[U(W)]. • Assuming returns of risky assets being jointly normally distributed, we leave ourselves with a 2-D diagram with mean of returns and standard deviation of returns (i.e, mean and s.d.) as our two only variables of focus • Derive indifference curves on the plane of return and risk as the right diagram with expected utility theory. Return Risk END-PRODUCT: Essentially, mean and standard deviation are the choice variables investors concern about in order to max their E[U(w)], which is given on the indifference curves.