Download
1 / 94
960 likes | 1.25k Vues
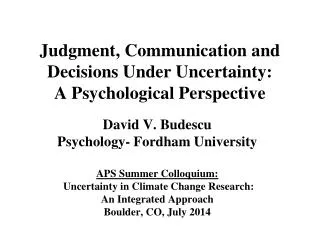
Judgment, Communication and Decisions Under Uncertainty: A Psychological Perspective. David V. Budescu Psychology- Fordham University APS Summer Colloquium: Uncertainty in Climate Change Research: An Integrated Approach Boulder, CO, July 2014. Overview.

E N D
Judgment, Communication and Decisions Under Uncertainty: A Psychological Perspective David V. Budescu Psychology- Fordham University APS Summer Colloquium: Uncertainty in Climate Change Research: An Integrated Approach Boulder, CO, July 2014
Overview • Why is the psychological perspective relevant to the CC community? • Some background and terminology • Judgment of uncertainty (probability) • Combining probabilities • Judge – DM interaction and communication • Individual decision making under uncertainty and with imprecise information • Group decision making (Social dilemmas) under uncertainty
Why is the psychological perspective relevant? • To turn science into action, the models’ results (forecasts, estimates and the corresponding uncertainties) need to be communicated to the public, stakeholders and DMs who do not necessarily understand the science, the model and the process • Sometimes the models depend on subjective probabilities (parameters, outcomes, etc.) that must be elicited from experts or stakeholders) • Introspection and insight– learn about one’s own tendencies, biases, etc
Behavioral Work in J/DM • Empirical (mostly experimental) research on the way DMs (individuals, small interacting groups) make decisions • Normative (axiomatic) – models of the decision problem • Descriptive (behavioral) – models of the decision maker • Phenomenon (data) driven
What is Probability? • The three interpretations of probability • Classical (Laplace) • Relative Frequency (Von Mises, Reichenbach): The probability of E is… • Subjective/Personal (Ramsey, De Finetti, Savage): My probability of E is… • The three approaches are not always differentiated and are often used interchangeably • This has been an area of (sometimes heated) theoretical disagreements
Variants of Uncertainty (K&T,1982) • External to the judge (Aleatory) • Distributional (“Outside” view) • Singular (“Inside” view) • Internal to the judge (Epistemic) • Reasoned (Arguments) • Direct (Experience) • These are useful as special cases but the classification is subjective and, often, ambiguous
Sources of Imprecision in Communication of Uncertainty ( Budescu & Wallsten 1995) • Nature of the event: An event is unambiguous (ambiguous) if its definition allows one to determine unequivocally if any given outcome is (is not) an exemplar of the target event. • Type of uncertainty underlying the event: Uncertainty is precise is it can be expressed by means of a proper probability function, and it is vague if such a function cannot be specified. • Language of communication: Numerical probabilities are the language of the precise communication, whereas intervals (e.g. 0.2 – 0.4), qualified values (e.g. around 0.6), and linguistic probabilities (e.g. highly likely) are examples of imprecise ones.
Types of Probabilities Judged (Lichtenstein, Fischhoff, Phillips, 1982) • Discrete events • Single target event & full range • C (C ≥ 2) alternatives & 1/C range • Continuous events (full distributions) • Fixed Value • Fixed Probability • Direct and indirect methods • Most of the work on discrete events (full or half range) and direct estimation
www.forecastingace.com Item Prediction Assigned probability Started in July 2011 and will continue for several years. Collects forecasts from voluntary judges Items from business, economy, military, policy, politics, health, science and technology, etc.
Other Methods • Distribute N points in k bins to construct a empirical probability distribution (Rotschild & Goldstein, 2014). • Pairwise comparisons and scaling (Por & Budescu, 2013) • Possibly, followed by fitting the density function
Ratio Judgments of Joint Probs of Smoking and Cancer (Por & Budescu 2013)
Assessing Quality of Judgements (Wallsten & Budescu, 1983) • Reliability / stability • Coherence / internal consistency • Static (binary additivity, Frechet bounds) • Dynamic (Bayesian updating) • Converging validity (procedural invariance) • External validity • Calibration
Measuring Calibration • Murphy (1972) decomposition of S(P) • For designated form: S(P) = V – R’ + C’ • Variance of outcome proportion • Resolution • Calibration • All vary with designation (as does bias) • Brier Score :
Possible Patterns of Confidence Curve A: over-prediction Curve B: under-estimation Curve C: over-extremity Curve D: under-extremity Diagonal line E: perfect calibration
Possible Explanations • Optimistic overconfidence • Confirmation • Ecological models • Random errors with asymmetric distributions
Factors Affecting Judgments • Cognitive (Heuristics) • Representativeness • Availability & Simulation • Anchoring & Adjustment • Motivational • Desirability • Confirmation / Motivated Reasoning • Affect • The structuring of the problem / task • Framing • Packing / Unpacking • Format / labeling / colors • Representation (probabilities vs frequencies)
Representativeness • Judge likelihood of event, E, according to the degree that it resembles (it is perceived as “representative of”) a model or process, M • Base-rate frequencies/prior probabilities • Insensitivity to sample size • Misconception of chance • Conjunction fallacy • Insensitivity to predictability • Misconception of regression (toward the mean)
Availability & Simulation • Judge likelihood of event, E, according to the ease with which it can be recalled, retrieved or imagined • Retrievability of instances • Effectiveness of a search set • Imaginability Both Representativeness and Availability can be explained by “attribute substitution” (Kahneman & Frederick, 2002) Link to two systems
Affect • The quality of ”goodness/ badness” that is experienced as a feeling state and marks the stimuli as positive/negative • Affect is attached to images that influence judgments • The evaluability of an attribute / dimension drives the precision of its affective feelings and increases its weight • Quantities evaluated may convey little meaning in the absence of appropriate context to induce the appropriate affective perspective • Examples: • Gambles become more attractive when a small loss is added! • Common ratio effect (Imagining the numerator)
Crowd Size Analysis • We analyze responses to 90 distinct items with at least 64 respondents • For each item we construct “pseudo-crowds” with n = 1, 2, 4, 8, 16, 32, 64 respondents • We average judges while keeping total amount of information constant: n individuals, n/2 dyads, n/4 tetrads, n/8 octads, etc… • We replicate the process 500 times • Our score is a transformation of the Brier Score: 100 = perfect, 0 = worst, 75 = “chance” (answer 50%) 34
Examples: Crowds Don’t necessarily Improve Mean Performance Hard Item: Crowd does not improve much Easy Item: Crowd does not improve much
Examples: Performance Peaks n=8 Slow Improvement More Pronounced Improvement
More on the Effects of the Crowd • A more conservative approach focuses on other values of the distribution of forecasts (not the mean) in the distribution’s lower tail • For example, one could model the values associated with the 25th percentile (Q1) or the 5th percentile of the distribution of forecasts • Since the starting point of these statistics is much lower, the rate of growth as a function on n is steeper and more impressive 37
Judge – DM interaction and communication
Preferences • In general, judges prefer to communicate uncertainty in vague terms but DMs prefer to receive precise information (Budescu & Wallsten, 1995; Brun & Teigen, 1998) • This is also the modal individual pattern • However, the pattern can be more complex and subtle
The Congruence Hypothesis • DMs are best served if uncertainty information is communicated in a way that matches the nature of the events and the underlying uncertainty. • It makes no sense to use precise language to communicate vague uncertainty about ambiguous events (The chances of an abrupt drop in the market in the near future is 0.2348) • DMs are best served when the nature and language of communication match the type of uncertainty and context (Erev et al. 1991) • DMs prefer communication modes that match the type of uncertainty (Olson & Budescu, 1997)
When (and Why) Do DMs Prefer Vague Information? (Du & Budescu, 2013) • Earnings per share (EPS) forecasts issued by management of publically traded companies (33,625 quarterly forecasts by 4,744 companies issued between 1996 and 2006) Range only – 36%; Point only – 22% Mixed – 42% (Range / Points = 3 / 1) Hypothesis – Management anticipates the investors’ expectations and seeks to communicate to them information that is congruent with the level and nature of uncertainty underlying the forecasts
Experimental results • DMs (MBA students) indicate preference to purchase companies that issue range forecasts • This preference is more pronounced when the information underlying the forecasts is vague • Non-monotonic pattern of attitude to imprecision – preference for moderate levels of vagueness (Yaniv’s accuracy-informativeness trade-off) • DMs (MBA students) judged range forecasts to be more informative, accurate and credible • DMs correctly expect range forecasts to be more accurate (not because they are wider!)
Sensitivity to Source of Uncertainty (Benjamin & Budescu, 2013) • CONFLICT: Expert A: 20 Expert B: 40 • VAGUENESS: Experts C and D: 20-40 • HYBRID: Expert X: 20-30 Expert Y: 30-40 • Conflict and vagueness contribute (not necessarily additively) to perceived uncertainty (Baillon & Cabantous, 2009; Smithson, 2013) • People are more averse to conflict than to vagueness (Smithson, 1999)
Extracting Information from Graphical Presentations of Uncertainty(Marcus & Budescu) • How does the presentation format of probability distributions affect people’s ability to extract (and use correctly) information? • Two between-subjects experiments comparing 4 displays (Quantile, CDF, Box, Density plot) with two distributions (Politics, Business). • In one experiment each plot was shown separately and in the other we presented conjoint plots • Performance was evaluated by (1) several items with known answers; (2) projection task (3) retrospective evaluations
4 Displays (clockwise from left: Quantile, CDF, Density, Box)
Conjoint Displays • Elements Combined: • CDF • Density • Box
Key Results • Subjects do a reasonable job of extracting information from the various displays • CDF / Quantile have best results • Box plots induced widest future projections • No difference in performance between the Conjoint displays and single displays with the Toggle option • The pairing of CDF and Box plot is best and outperforms any single display • Pairings involving Density are the worst • Subjects’ rate Conjoint displays and Quantile plots highest • Performance interacts with Numeracy and Education
Linguistic Probabilities • Verbal lexicons of probabilistic terms vary widely across individuals • Interpretations of probabilistic words are personal, subjective, susceptible to self-serving interpretations, and vary as a function of context • It is difficult to “standardize” or “legislate” the meaning of language • All these facts set the stage for a potential ”Illusion of Communication”