Download
1 / 34
340 likes | 432 Vues
Explore the rise and fall of Easter Island's population, from prosperity to famine and cannibalism. Learn about population ecology concepts and the tragic consequences of unsustainable growth.

E N D
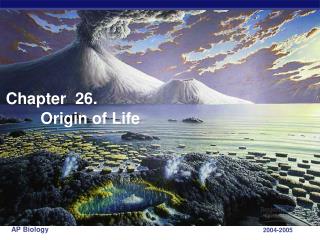
Chapter 26 Population Ecology
The human torch • Evidence states that Easter Island once had fertile soil, Straight healthy Palms, hau hau trees • By 1400 as many as 1000- 15,000 people lived on Easter Island. • Crop yields declined due to soil nutrients were depleted. • No one Fish offshore, all native birds had been eaten • Began raising rats as food • Large statues were erected to appease the gods to solve famine
The Human Torch • They eventually turned onto each other and eat the only source of protein available..
The human torch • 1722 explores found a few hundred Polynesians living in caves skittish and hungry. They saw grasses, scorched brush but no trees. Rock quarry with partially complete statues • 1724 James Cook visited and only encountered 4 canoes with many of the statues toppled over, some onto face-shattering spikes. • What happened??
Key concepts • 26.1 Population size, density and distribution • 26.2 How do we count? Total, quadrants, captures • 26.3 Population size and Exponential growth • 26.4 Limits to Population Growth • Limiting Factors • Carrying capacity • 26.5 Life History Patterns • 26.6 Natural History Populations Growth • 26.7 Human Population • 26.8 Fertility Rates and Age structure • 26.9 Population Growth and Economics Effects
26.1 Characteristics of Populations A.Each population—a group of individuals of the same species living in the same area (habitat)—has certain characteristics. 1. The population size is the number of individuals making up its gene pool. 2. Age structure defines the relative proportions of individuals of each age—especially with respect to reproductive years. 3. Population density is the number of individuals per unit of area or volume—the habitat. 4. Population distribution refers to the general pattern in which the population members are dispersed through its habitat.
26.1 Characteristics of Populations B. Populations can be dispersed in three patterns. 1. Members of a population living in clumps is very common for these reasons. a. Suitable physical, chemical, and biological conditions are patchy, not uniform. b. Many animals form social groups. c. Many offspring are not highly mobile and are forced to live “where they landed.”
26.1 Characteristics of Populations 2. Uniform dispersion is rare in nature; when it does occur, it is usually the result of fierce competition for limited resources. 3. Random dispersion occurs in nature if environmental conditions are rather uniform in the habitat and members are neither attracting nor repelling each other.
26.2 Elusive Heads to Count A. To determine the number of animals in a particular area, you could try a full count to measure absolute density; this may be difficult especially with elusive animals such as deer. B. You could divide up the area into smaller quadrats; count the number of deer in one quadrat and extrapolate the number for the whole area. C. Because many animals migrate a lot, it may be better to use the capture–recapture method.
26.3 Population Size and Exponential Growth A. Gains and Losses in Population Size 1. Population size is dependent on births, immigration, deaths, and emigration. 2. Population size may also change on a predictable basis as a result of daily or seasonal events called migrations.
26.3 Population Size and Exponential Growth B. From Zero to Exponential Growth 1. Zeropopulation growth designates a near balance of births and deaths. a. stable population size b. measured per capita (per head) * net production per individual per unit time * * Exponential growth
26.3 Population Size and Exponential Growth Exponential growth activity
26.3 Population Size and Exponential Growth 2. Rate of increase: r = net reproduction per individual per unit time. 3. The growth rate formula is: G = rN. a. A graphic plot of exponential growth results in a J-shaped curve that becomes steeper with advancing time. b. As long as r is positive, the population will continue to increase at ever-increasing rates—easily measured by noting the “doubling time.” World population clock exponential http://zebu.uoregon.edu/popgrowth.html
26.3 Population Size and Exponential Growth C. What Is Biotic Potential? 1. The biotic potential of a population is its maximum rate of increase under ideal—nonlimiting—conditions. 2. The biotic potential varies from species to species because of three parameters: a. at what age each generation starts reproducing, b. how often reproduction occurs, and c. how many offspring are born each time. 1. Humans and other large mammals 2-5% a yr
26.4 Limits on the Growth of Populations A. What Are the Limiting Factors? 1. The actual rate of increase of a population is influenced by environmental conditions. 2. Limiting factors (nutrient supply, predation, competition for space, pollution, and metabolic wastes) provide environmental resistance to population growth.
Scarcity of nesting sites for weavers population in Africa • Plenty of trees loosely associated nests • Few trees
26.4 Limits on the Growth of Populations B. Carrying Capacity and Logistic Growth 1. The sustainable supply of resources defines the carrying capacity for a particular population in a given environment. a. The carrying capacity can vary over time and is expressed graphically in the S-shaped curve pattern called logistic growth. b. density-dependent controls: any factors that operate when increases in population density lower the survival odds for the individual 1. Dwindled resources 2. As DDC inc so does predation c. Density –independent controls: causes more deaths then births
26.4 ? The graph shows a logistic population curve. At what level do the deer reach their CARRYING
David Klein's classic study of the reindeer on St. Matthew Island. • In 1944 a population of 29 animals was moved to the island, without the corrective feedback (negative feedback) of such predators as wolves and human hunters. • In 19 years the population swelled to 6,000 and then "crashed" in 3 years to a total of 41 females and one male, all in miserable condition. • Klein estimates that the primeval carrying capacity of the island was about 5 deer per square kilometer. At the population peak there were 18 per square kilometer. • After the crash there were only 0.126 animals per square kilometer and even this was probably too many once the island was largely denuded of lichens.
David Klein's classic study of the reindeer on St. Matthew Island. • In 1944 29 animals.
2. Logistic growth deals with density-dependent controls. • a. The main density-dependent factors are competition for resources, predation, parasitism, and disease. • b. These factors exert their effects in proportion to the number of individuals present.
C. Density-Independent Factors 1 Some events, such as weather, tend to increase the death rate without respect to the number of individuals present. 2. Lightning, floods, snowstorms, and the like affect large populations as well as small groups.
26.5 Life History Patterns A. Each species has a life history pattern that influences survival, fertility, and the age of first reproduction. B. Life Tables • 1. Life tables follow the fate of a group of newborn individuals (cohort) through their lives to calculate the survivorship schedule. • 2. The number of offspring born to individuals in each age interval is also recorded.
26.5 Most animals are characterized by one of these types of curves. a. A Type I curve is typical of large mammals where few offspring are produced and cared for so that infant mortality is low; death usually comes after an extended life. b. A Type II curve is typical of many animals where the chances of survival or death are about the same at any age. c. A Type III curve indicates low survivorship, or conversely, high mortality in early life.
26.7 Human Population Growth A. Notice these startling statistics: 1. The world population reached 6 billion in 1999. 2. The annual rate of increase averaged 1.3 percent. B. How did the human population grow to such large numbers? 1. Humans expanded into new habitats and climatic zones. 2. Agriculture increased the carrying capacity of the land to support humans and their animals. 3. Medical practice and improved sanitation conditions removed many population-limiting factors. 4. New forms of energy from fossil fuels ushered in the industrial revolution.
26.8 Fertility Rates and Age Structure A. At the present rate of increase, the world human population may reach 8.9 billion by 2050. 1. The total fertility rate (TFR) is the average number of children born to women during their reproductive years, and is currently 2.8 children per female. 2. Even if the replacement level of fertility is achieved (about two children per woman), the human population will continue to grow for another sixty years. B. Any population with a broadly based age structure (many women in reproductive years) will continue explosive population growth.
26.9 Population growth A. Demographic Transitions 1. In the demographic transition model, changes in population growth are linked to four stages of economic development. a. In the preindustrial stage, living conditions are harsh; birth and death rates are high; and there is little increase in population size. B In the transitional stage, living conditions improve; death rate drops; and birth rate remains high. C. In the industrial stage, growth slows. D In the postindustrial stage, zero population growth is reached; birth rate falls below death rate.
A+ 96% • A 91% • A- 88% • B+ 85% • B 81% • B- 78% • C+ 75% • C 71% • C- 68% • D+ 66% • D 55% • D- 50% • F Below 50%
The Wolf, the Moose, and the Fir Tree:Who Controls Whom on Isle Royale?