Landsat Benefit Analysis: Study Overview
250 likes | 382 Vues
Landsat Benefit Analysis: Study Overview.

Landsat Benefit Analysis: Study Overview
E N D
Presentation Transcript
Landsat Benefit Analysis:Study Overview Richard Bernknopf, Will Forney, and Tamara WilsonWestern Geographic Science Center (WGSC)Natalie Sexton, Lynne Koontz, Holly Stinchfield, and Earlene SwannPolicy Analysis and Science Assistance Branch (PASA)Fort Collins Science CenterMolly Macauley, Resources For the Future (RFF)
Overview of Larger Study • Landsat Benefit Analysis: Conduct an analysis of the benefits of moderate resolution imagery • Western Geographic Science Center (WGSC) • Policy Analysis and Science Assistance (PASA) • 5 year effort (2006-2011) • Survey of users of moderate resolution imagery (PASA) • Risk assessment (WGSC): Estimate the economic value of moderate resolution imagery information
Study components • A review of the existing literature and macroeconomic analysis – RFF, WGSC • An in-depth survey of societal benefits – PASA • Case studies – WGSC, RFF Agricultural production
Societal Uses and Benefits of Moderate Resolution Imagery in the United States:A Survey Update Natalie Sexton, Lynne Koontz, Holly Stinchfield, and Earlene SwannPolicy Analysis and Science Assistance BranchFort Collins Science Center
Policy Analysis and Science Assistance (PASA) • Multidisciplinary team of researchers • Mission: integrate biological, social, and economic analyses to aid resource managers in decision making and resource management conflicts • NR survey research expertise Von Karman Vortices (http://eros.usgs.gov/imagegallery/index.php/)
Survey Objectives Better understand the uses of moderate resolution imagery, including those previously not captured or detailed • Identify and classify users • Understand how and why imagery is being used • Qualitatively and quantitatively measure societal benefits of this imagery
Survey Components • Phase I: • User assessment • Potential user identification • Refinement through snowball sampling • Phase II: • User survey Kamchatka Peninsula (http://eros.usgs.gov/imagegallery/index.php)
Phase I: User Assessment • Identify potential users of moderate resolution imagery, verify their use, elicit other users • Why is this important? • Population of moderate resolution imagery users in the United States is unknown
Phase I: User Assessment • Identify potential individual users • Web search by state • Over 22,000 email addresses of potential users • Identify user groups • Web search yielded several user groups • GIS/remote sensing user groups • Small, local organizations • ≤ 1000 members • 261 groups
Phase I: User Assessment • Web-based snowball sampling to verify users and elicit additional users • Advantages: • Good for unknown, or hard to reach populations • Quick and cost-effective • Can trace social networks • Disadvantages: • Isolated individuals can be missed • Final sample may not be random • More difficult to calculate population size and other statistics • To increase randomness: • Begin with contacts from many sources • Have a large sample derived from many waves (Atkinson & Flint, 2001; Blanken et al., 1992; Faugier & Sargeant, 1997; Tsvetovat, 2006)
Stages in the Snowball Sampling Wave 4 Wave 3 Wave 2 Wave 1 Seed Seed sends names of three contacts (Wave 1) Wave 1 respondents each send the names of three contacts (Wave 2) Each wave provides exponentially more contacts
Stages in the Snowball Sampling Development of Initial Contact List ~22,000 Respondents ~2600 Wave 4 Wave 3 Wave 2 Moderate Resolution Imagery Users ~2000 Wave 1 ~ 2000
Phase I: User Assessment Verification of Application
Phase I: User Assessment Verification of Application
Phase II: User Survey • Review of previous surveys • EROS (2007) • ASPRS (2006) • Executive Office of Science and Technology Policy Survey (2004) • NASA (2001) • Limitations of previous surveys • Results were not generalizable to the population of moderate resolution imagery users • None used a random sample • Most were technical in nature and did not ask about the benefits or value of the imagery (ASPRS being the exception)
How will this survey be different? • Who is being surveyed? • A wider array of users, including end users of Landsat products • Other studies have surveyed only specific groups of users (i.e., purchasers of Landsat imagery) • What is being asked? • Focus on new and unique uses • Societal benefits – not just monetary • Not focusing on technical aspects of the satellite
Categories of Questions for Survey • Identify and classify users • Document uses • Document value and benefits of imagery
Identify and Classify Users • Use of moderate resolution imagery • If no, determine reason and use of other types of imagery • If “don’t know,” provide more extensive definition and examples to clarify • Type of organization (i.e., government, private, non-profit) • Type of user (i.e., supplier, processor, end user) • Where and how often imagery is obtained • Demographics
Document Uses of Imagery • Applications of imagery • Scale of projects (i.e., local, regional, national, global) • Use of imagery in decision making • New uses of imagery in the past 5 years • Possible uses of imagery in the next 5 years
Document Value and Benefits of Imagery • Importance of and satisfaction with imagery attributes • Advantages of using moderate resolution imagery over other data/methods • Repercussions from loss of access to moderate resolution imagery • Limitations of currently available imagery • Willingness to pay for imagery • Value of information provided by imagery
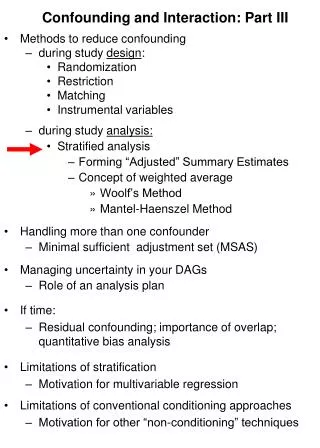
Economic decisions with estimation risk: a regional-scale agricultural example • What land is allocated where? • What will be the ramifications? • How much GHG emissions? • How is better satellite information involved? • Does MLRI reduce ambiguity? Conflict and unanticipated consequences among agricultural, energy, and environmental policies
Prices Land Attributes Information, MLRI Policies Management Decisions: Land Use, Input Use • Agricultural Case Study: • Economic Models • Physical Models • Estimates and Accounting • Policy Analysis Pollution: (erosion, GHG, water quality, habitat alteration, human health) Acres/Yield Joint Distribution of Output and Pollution Accounting practices and GHG market Statistical Aggregation and Uncertainty Measures Welfare and Policy Analysis Adapted from Antle and Just, 1991
Agriculture case study: 3 easy pieces Microeconomic model Agricultural + GHG production Total economic value The farm produces the joint product of corn and GHG emissions Regional portfolio model: societal risk and return of land allocation Societal expected return and risk of investment The regional portfolio is a statistical and visual representation of land use Value of MLRI: economic benefit of resolving spatial and temporal uncertainty Bayesian approach to revised production and emission forecasting and reduced market and regulatory uncertainty VOI arises from more informed crop planting and management decisions
Model input details • Price: crop yields (corn), production inputs, other commodities (food and fuel) • Policies: Extensive and Intensive • Land Attributes: soil properties, nutrients, moisture endowments, slope, land cover • Information and MLRI: prior years, production technology, spatial and temporal variability, monitoring of policies/landscapes