Download
1 / 18
180 likes | 395 Vues
Liquid Effluent Dilution Factor. RETS-REMP WORKSHOP June 25, 2012 Greg Jones R. E. Ginna Nuclear Power Plant Constellation Energy Nuclear Group, LLC. Introduction.

E N D
Liquid Effluent Dilution Factor RETS-REMP WORKSHOP June 25, 2012 Greg Jones R. E. Ginna Nuclear Power Plant Constellation Energy Nuclear Group, LLC
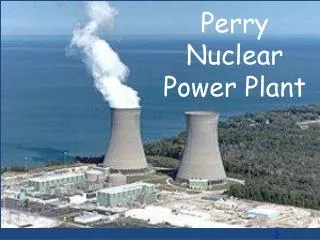
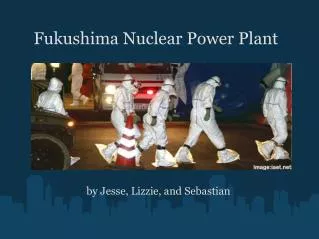
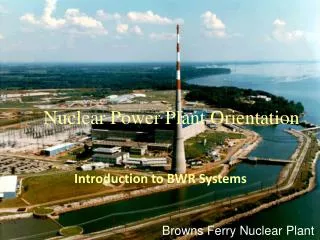
Introduction R. E. Ginna Nuclear Power Plant is a 589 MWe Westinghouse Pressurized Water Reactor located on the south shore of beautiful Lake Ontario in Western New York. Initial criticality was 1969 with commercial operation commencing in 1970. We have a liquid effluent drinking water pathway for offsite dose at the Town of Ontario Water District (OWD) intake 1.3 miles east of Ginna on the Lake Ontario shore.
Background We all own a liquid effluents program. Not all plants have a potable water pathway, and fewer still have a potable water pathway in a lake. This presentation is intended to be a review of basic principles of liquid effluents and a discussion of change management relative to effluent pathways. Please feel free to ask questions at the end or one on one with me or Dean Discenza. We brought technical details with us beyond the PowerPoint.
Background The original liquid effluent dilution factor for the potable water pathway was determined in 1965 by introducing a tracer into the discharge canal at a known concentration over several months. These dilution factors were conservative estimates based on steady-state conditions and did not account for thermal decay of discharge plume due to atmospheric interactions, thermal stratification of lake waters, and spatially variable currents in offshore waters.
Background • The intended result was a conservative bounding condition for calculation of liquid effluent dose. • Calculation of meteorological and hydrological models in 1965 would have been done by hand using slide rules. • The results were adequate for the purpose but would not have resolved many of the factors that we are able to resolve today.
Background • Mode of transport from Ginna to OWD was by onshore drift and dispersion to the intakes located 1200 feet offshore at a depth of 12 feet. • OWD underwent expansion and upgrade of facilities in 2002. • The intake was moved 4800 feet offshore at a depth of 50 feet. • How would this affect Ginna effluents?
Liquid Effluent Dilution Factor • It seemed obvious that the volume of water into which the routine effluent activity was mixing had just increased dramatically. • As fuel performance, source term control, and liquid effluent processing have improved continuously over the past 40 years, the environmental footprint of Ginna has changed. • Calculated offsite dose consequence has shifted to tritium as the principal nuclide and the drinking water pathway has become the principal offsite dose pathway.
Liquid Effluent Dilution Factor • It is important to note that total offsite dose due to operation of Ginna is dramatically lower than in past decades. • What has changed is the percent of the total that is due to the drinking water pathway. • So why does this matter?
Liquid Effluent Dilution Factor • Annual dose to the maximum exposed member of the public from gaseous effluents is approximately equal to the dose to the maximum exposed member of the public from liquid effluents. • However, gaseous effluent dose drops off quickly with distance from the plant. • All customers of the municipal water supply receive the same calculated maximum dose making this the major driver for population dose from operation of the plant.
Liquid Effluent Dilution Factor • Although the offsite dose consequence of the operation of Ginna is very small, we are required to accurately report calculated dose. • An overly conservative calculation presents little risk during periods of low releases. However we are not in complete control of factors that can increase Curies in releases – fuel defects, equipment failure, outage events, even accidents. • Our calculated dose is what we report to the public and that is who we are ultimately accountable to.
Liquid Effluent Dilution Factor • So let’s see about determining a new ODCM dilution factor. • Regulatory Guide 1.113, Estimating Aquatic Dispersion Of Effluents From Accidental And Routine Reactor Releases For The Purpose Of Implementing Appendix I. • The Reg Guide provides a specific discussion of Liquid Effluent mixing in various receiving waters of interest including the Great Lakes. • Great ! Let’s get started !
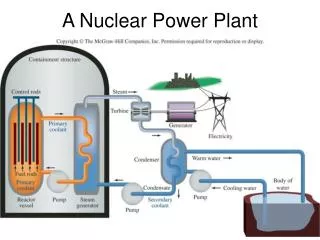
Steady Point-Source Dilution Model Diffusion model for a steady point-source discharge for a point at the origin of the x-axis and a distance ysfrom the shoreline and zs beneath the water surface. For a large lake of constant depth d and straight shoreline the solution is: Where:
Liquid Effluent Dilution Factor • We hired HydroQual Environmental. • A Ginna specific hydrodynamic and thermal model was developed. • A one-year simulation with a continuous release of a conservative (non-decaying) tracer was conducted for 2008 meteorological conditions. • Monthly average dilution factors at the OWD intake were calculated and the minimum monthly average value was chosen as liquid effluent dilution factor.
Liquid Effluent Dilution Factor • Why was minimum monthly average dilution factor appropriate? • Dilution factor at the intake varied from 200 to 575. • Average conditions on an annual basis put the dilution at 360.
Liquid Effluent Dilution Factor • The guidance in RG 1.113 describes calculation of annual average radiation doses to the public, so use of the annual average dilution factor would be acceptable. • This study was based only on 2008 meteorological conditions , so Ginna felt that the more conservative monthly minimum average value for dilution was appropriate. • Historical meteorology was reviewed to verify that 2008 data was representative if not maximum.
Summary • Changes in receptor location led to a need to re-evaluate liquid effluent dose calculations. • The change had a consequential impact on calculated offsite dose due to liquid effluents – a factor of ten decrease in dose. • Because of how liquid dose from the potable water pathway is calculated, this change had a similar magnitude impact on population dose.
Take Aways • Challenge assumptions – offsite dose consequence of effluents will change over time and in some cases the change will be dramatic. • Overly conservative models are allowable but might not be prudent. Sharpen your pencils. • We encounter many examples of changes that affect the effluents program: Plant modifications, Power uprate, Source term reduction strategies, Fuel performance improvement (or not), climate change, others?