Download
1 / 64
640 likes | 657 Vues
This report provides an overview of key trends in the U.S. wind power market in 2014, including installation, industry, technology, performance, and cost trends. The report also discusses policy and market drivers and provides a future outlook for the industry.

E N D
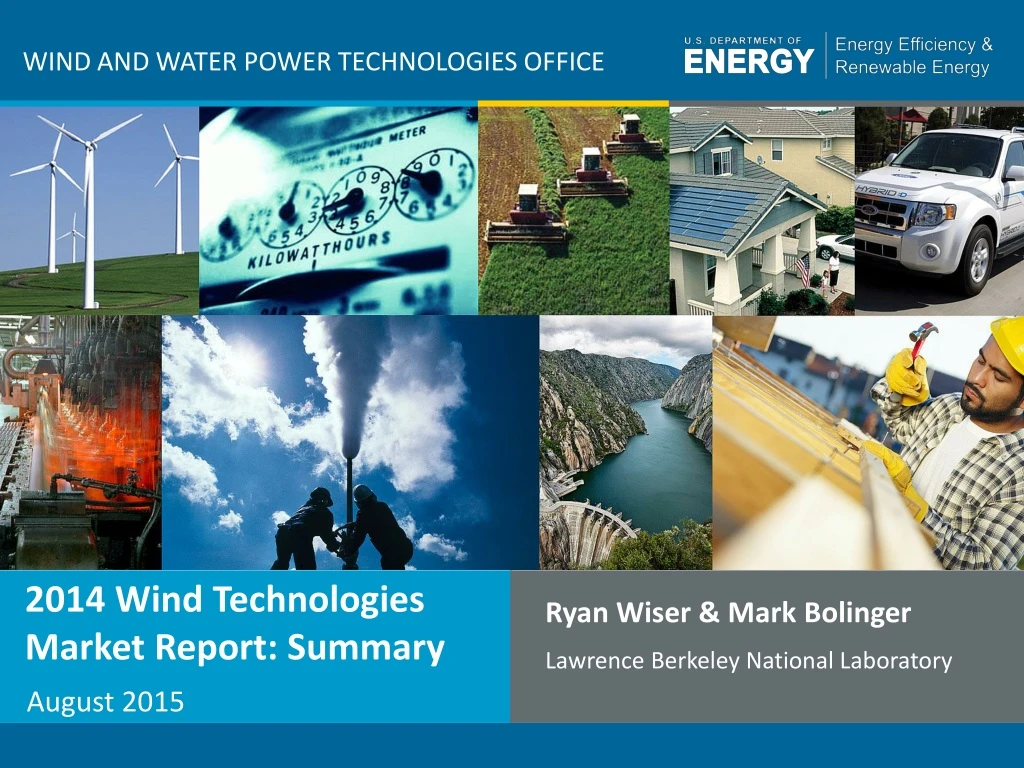
WIND AND WATER POWER TECHNOLOGIES OFFICE Ryan Wiser & Mark Bolinger Lawrence Berkeley National Laboratory August 2015 2014 Wind Technologies Market Report: Summary
Purpose, Scope, and Data: • Publicly available annual report summarizing key trends in the U.S. wind power market, with a focus on 2014 • Scope primarily includes wind turbines over 100 kW in size • Separate DOE-funded annual reports on distributed and offshore wind • Data sources include AWEA, EIA, FERC, SEC, etc. (see full report) Report Authors: • Primary authors: Ryan Wiser and Mark Bolinger, Berkeley Lab • Contributions from others at Berkeley Lab, Exeter Associates, NREL Funded by: U.S. DOE Wind & Water Power Technologies Office Available at: http://energy.gov/eere/wind 2014 Wind Technologies Market Report
Report Contents • Installation trends • Industry trends • Technology trends • Performance trends • Cost trends • Wind power price trends • Policy & market drivers • Future outlook
Key Findings • Annual wind capacity additions rebounded in 2014, with significant additional new builds anticipated for 2015 and 2016 • Wind has been a significant source of new electric generation capacity additions in the U.S. in recent years • Supply chain has been under duress, but domestic manufacturing content for nacelle assembly, blades, and towers is strong • Turbine scaling is boosting expected wind project performance, while the installed cost of wind projects is on the decline • Wind power sales prices have reached all-time lows, enabling economic competitiveness despite low natural gas prices • Growth after 2016 remains uncertain, dictated in part by future natural gas prices and policy decisions, though recent declines in the price of wind energy boost future growth prospects
Wind Power Additions Rebounded in 2014, with 4,854 MW of New Capacity Added • $8.3 billion invested in wind power project additions in 2014 • Wind build well off annual additions from 2007 through 2012 • Cumulative wind capacity up nearly 8%, bringing total to 65.9 GW
Wind Power Represented 24% of Electric-Generating Capacity Additions in 2014 From 2007-2014, wind comprised 33% of capacity additions nation-wide, and a much higher proportion in some regions
The U.S. Placed 3rd in Annual Wind Power Capacity Additions in 2014 Global wind additions reached a new high in 2014 U.S. remains a distant second to China in cumulative capacity U.S. led the world in wind energy production in 2014
U.S. Lagging Other Countries in Wind As a Percentage of Electricity Consumption Note: Figure only includes the countries with the most installed wind power capacity at the end of 2014
Geographic Spread of Wind Projects in the United States Is Reasonably Broad Note: Numbers within states represent cumulative installed wind capacity and, in brackets, annual additions in 2014
Texas Installed the Most Capacity in 2014; 9 States Exceed 12% Wind Energy Texas has more than twice as much wind capacity as any other state 23 states had >500 MW of capacity at end of 2014 (16 > 1 GW, 10 > 2 GW) 2 states have >25% of total in-state generation from wind (9 states > 12%)
No Commercial Offshore Wind Turbines Commissioned; 1 Project in Construction and 18 in Various Stages of Development • 30 MW Block Island project (RI) started construction in 2015 • BOEM has granted 5 competitive leases; DOE funding 3 pilot deployments • Legal and political headwind for high-profile projects: • Cape Wind (MA) power purchase agreements cancelled by utilities • Fishermen’s Atlantic City (NJ) rejected by state PUC • Dominion (VA) announced delay due to cost • Pressing challenges include cost, lack of PPAs and policy incentives, regulatory complexity
Interconnection Queues Demonstrate that a Substantial Amount of Wind Is Under Consideration Wind represented 30% of capacity in sampled 35 queues But… absolute amount of wind (and coal & nuclear) in sampled queues has declined in recent years whereas natural gas and solar capacity has increased Not all of this capacity will be built…. • AWEA reports 13.6 GW of capacity under construction after 1Q2015
Larger Amounts of Wind Planned for Texas, Midwest, Southwest Power Pool, PJM, and Northwest Not all of this capacity will be built….
GE, Siemens, and Vestas Captured 98% of the U.S. Market in 2014 • Recent dominance of the three-largest turbine suppliers in the U.S. market • Globally, Vestas remained the top supplier, followed by Siemens and GE • Chinese suppliers occupied 8 of the top 15 spots in the global ranking, based almost entirely on sales within their domestic market
Manufacturing Supply Chain Continued to Adjust to Swings in Domestic Demand • Realignment Continued… • Uncertain medium-term demand and growing global competition led to 12 domestic manufacturing facility closures in 2014; only 1 new facility opened • Nonetheless, many supply chain manufacturers remain • Over last decade, manufacturers have localized and expanded U.S. presence • “Big 3” OEMs all still have at least one domestic facility • Wind related jobs increased from 50,500 in 2013 to 73,000 in 2014 Note: map not intended to be exhaustive
Domestic Manufacturing Capability for Nacelle Assembly, Towers, and Blades Is Reasonably Well Balanced Against Demand Forecasts for 2015 and 2016
Turbine OEM Profitability Has Generally Rebounded Over the Last Two Years
Imports of Wind Equipment Are Sizable; Exports Continue to Grow Slowly U.S. is a net importer of wind equipment Exports of wind-powered generating sets increased modestly in 2014 to $488 billion; no ability to track other wind-specific exports, but total tower exports equalled $116 million • Figure only includes tracked trade categories; misses other wind-related imports • See full report for the assumptions used to generate this figure
Tracked Wind Equipment Imports in 2014: 42% Asia, 39% Europe, 20% Americas Note: Tracked wind-specific equipment includes: wind-powered generating sets, towers, hubs and blades, wind generators and parts.
Source Markets for Imports Vary Over Time, and By Type of Wind Equipment • Majority of imports of wind-powered generating sets from home countries of OEMs, dominated by Europe and Asia • Majority of imports of towers from Asia, but decline in recent years after tariff measures largely stopped imports from China and Vietnam • Majority of imports of blades & hubs from Brazil and China in recent years • Globally diverse sourcing strategy for generators & parts, dominated by Asian and European countries
Domestic Manufacturing Content Is Strong for Nacelle Assembly, Towers, and Blades, but U.S. Is Highly Reliant on Imports for Equipment Internal to the Nacelle Domestic Content for 2013 – 2014 Turbine Installations in the U.S. Imports occur in untracked trade categories, including many nacelle internals Overall estimated domestic content: ~40% in 2012 for wind turbine equipment; ~60% if considering total projects costs, including balance-of-plant
The Project Finance Environment Remained Strong in 2014 Project sponsors raised $5.8 billion of tax equity (largest single-year amount on record) and $2.7 billion of debt in 2014 Tax equity yields held steady, while debt interest rates trended lower
Utility Ownership of Wind Rebounded Somewhat in 2014; IPPs Still Dominate
Long-Term Contracted Sales to Utilities Remained the Most Common Off-Take Arrangement, but Merchant Projects Continued to Expand, at Least in Texas • Recently announced wind purchases of ~2 GW from technology companies and business giants to hospitals, universities, and government agencies
Turbine Nameplate Capacity, Hub Height, and Rotor Diameter Have All Increased Significantly Over the Long Term
Growth in Rotor Diameter Has Outpaced Growth in Nameplate Capacity and Hub Height in Recent Years Nameplate Capacity Rotor Diameter Hub Height
Turbines Originally Designed for Lower Wind Speed Sites Have Rapidly Gained Market Share Specific Power Specific Power by IEC Class 2 & 3 IEC Class
Turbines Originally Designed for Lower Wind Speeds Are Now Regularly Used in Lower and Higher Wind Speed Sites, Whereas Taller Towers Predominate in the Great Lakes and Northeast By Wind Resource Quality By Region
Sample-Wide Capacity Factors Have Increased, but Impacted by Curtailment and Inter-Year Wind Resource Variability Note: The wind resource index is compiled from NextEra Energy Resources reports
Wind Curtailment Has Generally Declined in Recent Years; Higher in MISO and New England than in Other Regions Except for BPA, data represent both forced and economic curtailment In areas where curtailment has been particularly problematic in the past – principally in Texas – steps taken to address the issue have born fruit
Even Controlling for These Factors, Average Capacity Factors for Projects Built After 2005 Have Been Stagnant, Averaging 32% to 35% Nationwide
Trends Explained by Competing Influence of Lower Specific Power and Build-Out of Lower Quality Wind Resource Sites Reversal of build-out in lower wind speed sites in 2013 and 2014: likely to show up in capacity factor data next year • All else equal: • Drop in average specific power will boost capacity factors • Building projects in lower wind resource sites will reduce capacity factors
Controlling for Wind Resource Quality and Specific Power Demonstrates Impact of Turbine Evolution Notwithstanding build-out of lower-quality wind resource sites, turbine design changes are driving capacity factors higher for projects located in given wind resource regimes
Controlling for Wind Resource Quality and Commercial Operation Date Demonstrates Impact of Turbine Evolution Notwithstanding build-out of lower-quality wind resource sites, turbine design changes are driving capacity factors higher for projects located in given wind resource regimes
Regional Variations in Capacity Factors Reflect the Strength of the Wind Resource and Adoption of New Turbine Technology
Wind Turbine Prices Remained Well Below the Levels Seen Several Years Ago Recent turbine orders reportedly in the range of $850-1,250/kW
Lower Turbine Prices Drive Reductions in Reported Installed Project Costs • 2014 projects had an average cost of $1,710/kW, down $580/kW since 2009 and 2010 (up slightly from small sample of 2013 projects) • Limited sample of under-construction projects slated for completion in 2015 suggest no material change in costs
Economies of Scale Evident, Especially at Lower End of Project & Turbine Size Range Project Size Turbine Size
Regional Differences in Average Wind Power Project Costs Are Apparent, but Sample Size Is Limited Different permitting/development costs may play a role at both ends of spectrum: it’s easier/cheaper to build in the US interior and harder/more expensive along the coasts
Operations and Maintenance Costs Varied By Project Age and Commercial Operations Date Capacity-weighted average 2000-14 O&M costs for projects built in the 1980s equal $34/MWh, dropping to $24/MWhfor projects built in 1990s, to $10/MWh for projects built in the 2000s, and to $9/MWh for projects built since 2010 Note: Sample is limited, and consists of 147 wind projects totaling 10,350 MW; few projects in sample have complete records of O&M costs from 2000-14; O&M costs reported here DO NOT include all operating costs
Operations and Maintenance Costs Varied By Project Age and Commercial Operations Date Note: Sample size is limited O&M reported in figure does not include all operating costs: Statements from public companies with large U.S. wind asset bases report total operating costs in 2014 for projects built in the 2000s of ~$21-25/MWh
Berkeley Lab collects data on historical wind power sales prices, and long-term PPA prices • PPA sample includes 363 contracts totaling 32,641 MW from projects built from 1998-2014, or planned for installation in 2015 or 2016 • Prices reflect the bundled price of electricity and RECs as sold by the project owner under a power purchase agreement • Dataset excludes merchant plants and projects that sell renewable energy certificates (RECs) separately • Prices reflect receipt of state and federal incentives (e.g., the PTC or Treasury grant), as well as various local policy and market influences; as a result, prices do not reflect wind energy generation costs Sample of Wind Power Prices
Wind PPA Prices Have Reached All-Time Lows, Dominated by Interior Region
A Smoother Look at the Time Trend Shows Steep Decline in Pricing Since 2009; Especially Low Pricing in Interior Region