Speed, Velocity & Kinematics in Physics
Explore the concepts of speed, velocity, acceleration, and time graphs in kinematics with diagrams and examples. Learn the equations of motion and analyze different motion scenarios.

Speed, Velocity & Kinematics in Physics
E N D
Presentation Transcript
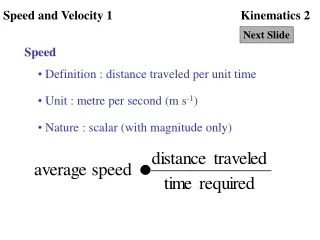
Speed and Velocity 1 Kinematics 2 Next Slide Speed • Definition : distance traveled per unit time • Unit : metre per second (m s-1) • Nature : scalar (with magnitude only)
Speed and Velocity 2 Kinematics 2 Next Slide Velocity • Definition : displacement traveled per unit time • Unit : metre per second (m s-1) • Nature : vector (with magnitude and direction)
Speed and Velocity 3 Kinematics 2 Next Slide Concepts of speed and velocity • Daily Use of Terms and Description Photo • Different kinds of motion Difference between speed and velocity • Different descriptions of motions • e.g. small velocity but high speed • Example Calculation
Acceleration 1 Kinematics 2 Next Slide Acceleration • Definition : change in velocity per unit time • Unit : metre per second squared (m s-2) • Nature : vector (with magnitude and direction) • Accelerating motion and decelerating motion Diagram Calculation
Acceleration 2 Kinematics 2 Next Slide Ticker Timer • Frequency : 50 Hz • Time Duration between 2 dots : 0.02s • Different patterns of dots Diagram • Calculation of velocity/acceleration from dots Calculation • Tape chart Diagram
Acceleration 3 Kinematics 2 Next Slide Stroboscope • Frequency depends on the machine • Time Duration between 2 images : calculated from the frequency • Calculation of speed/velocity/acceleration from images Calculation
Time Graphs 1 Kinematics 2 Next Slide Time graphs • Three different kinds of time-graphs • Linear motions only • Direction shown by the sign of the data • Displacement vs time graphs (s vs t graphs) • Velocity vs time graphs (v vs t graphs) • Acceleration vs time graphs (a vs t graphs)
Time Graphs 2 Kinematics 2 Next Slide Displacement vs time graphs • Constant displacement situation • Constant velocity situation • Constant acceleration situation • The graphs’ slope and velocity Graph
Time Graphs 3 Kinematics 2 Next Slide Velocity vs time graphs • Constant displacement situation • Constant velocity situation • Constant acceleration situation • The graphs’ slope and acceleration Graph • The graphs’ area and displacement Graph
Time Graphs 4 Kinematics 2 Next Slide Acceleration vs time graphs • Constant displacement situation • Constant velocity situation • Constant acceleration situation • The graphs’ area and change in velocity Graph
Equations of Motion 1 Kinematics 2 Next Slide Equations of motion • Linear motions only • Constant acceleration situation only • Direction given by the signs of the values • Introduction of parameters involved Diagram
Equations of Motion 2 Kinematics 2 Next Slide Equations of motion • Example 1 Calculation • Example 2 Calculation • Example 3 (Turning point) Calculation
Equations of Motion 3 Kinematics 2 Next Slide Projectile motion • Acceleration due to gravity (g) = 10 m s-2 • It is always pointing downwards • Projectile Motion Calculation • Example Calculation
Back to Speed and Velocity 3 Kinematics 2 Click Back to Different kinds of motion Constant speed (slow) Constant speed (fast) Moving slower and slower Moving faster and faster
C North 36.9° 4 m A B 3 m Back to Speed and Velocity 3 Kinematics 2 Click Back to Consider the motion of the person in the following diagram. He takes 6 seconds to travel 3 m due east from A to B. He takes 4 seconds to travel 4 m due north from B to C. Average speed from A to C Average velocity from A to C
Back to Acceleration 1 Kinematics 2 Click Back to Accelerating motion Decelerating motion
2 m s-1 6 m s-1 Back to Acceleration 1 Kinematics 2 Click Back to An object changes its velocity from 2 m s-1 to 6 m s-1 in 4 seconds. What is its acceleration?
Starting point Back to Acceleration 2 Kinematics 2 Click Back to Different pattern of dots Small constant velocity Large constant velocity Accelerating motion Decelerating motion
2 cm 5 cm 8 cm A B C D Back to Acceleration 2 Kinematics 2 Click Back to A paper tape is shown in the following diagram. Average velocity (from A to B) Average velocity (from C to D) Acceleration Average velocity (whole path) This is so-called the 2-tick interval.
Cut the following tape according to the dotted lines. Back to Acceleration 2 Kinematics 2 Click Back to velocity Arrange the tapes (2-tick interval) side by side Join the top of each tape Add x-axis (time) and y-axis (velocity) Suitable scale should be chosen for x-axis (time) and y-axis (velocity) We can choose different intervals time
The images of an object sliding down an inclined plane : A B Frequency of stroboscope = 10 Hz C D 2 cm 5 cm E 8 cm 11 cm Back to Acceleration 3 Kinematics 2 Click Back to Time between successive images Average velocity (from A to B) Average velocity (from C to D) Acceleration
s (m) s (m) s (m) 4 3 t(s) t (s) t (s) 2 2 0 0 Back to Time Graphs 2 Kinematics 2 Click Back to Slope = 0 Velocity = 0 m s-1 Slope = 2 Velocity = 2 m s-1 Constant displacement Constant velocity Slope is increasing Velocity is increasing Slope of s-t graph = Velocity at that time Constant acceleration
v (m s-1) v(m s-1) v(m s-1) 4 t (s) t (s) t (s) 2 2 0 0 4 2 Back to Time Graphs 3 Kinematics 2 Click Back to Slope = 0 Acceleration = 0 m s-2 Slope = 0 Acceleration = 0 m s-2 Constant displacement Constant velocity Slope = 2 Acceleration = 0 m s-2 Slope of v-t graph =Acceleration at that time Constant acceleration
v (m s-1) v(m s-1) v (m s-1) 4 t(s) t (s) t (s) 2 2 0 0 4 2 0 Back to Time Graphs 3 Kinematics 2 Click Back to Area = 0 Displacement traveled = 0 m Area = 8 Displacement traveled = 8 m Constant displacement Constant velocity Area = 8 Displacement traveled = 4 m Area of v-t graph = Displacement traveled Constant acceleration
a (m s-2) a(m s-2) a(m s-2) t(s) t (s) t (s) 2 2 0 0 4 2 0 Back to Time Graphs 4 Kinematics 2 Click Back to Area = 0 Change in velocity = 0 m s-1 Area = 0 Change in velocity = 0 m s-1 Constant displacement Constant velocity Area = 8 Change in velocity = 8 m s-1 Area of a-t graph = Change in velocity Constant acceleration
u = initial velocity v = initial velocity a = acceleration s = displacement traveled t = time required Kinematics 2 Back to Equations of Motion 1 Click Back to Equations of Motion : (take forward direction as +ve)
u = 2 m s-1 v = 8 m s-1 a = ? s = ? t = 4 sec Back to Equations of Motion 2 Kinematics 2 Click Back to +ve acceleration means the object is accelerating +ve displacement means forward displacement
u = 8 m s-1 v = 2 m s-1 a = ? s = 10 m t = ? Back to Equations of Motion 2 Kinematics 2 Click Back to -ve acceleration means the object is decelerating
u = 8 m s-1 v = ? a = -2 m s-1 s = ? t = 6 s Back to Equations of Motion Kinematics 2 Click Back to -ve final velocity means the object is moving backwards at that time. Where is the “turning point”? At t = 4 s, the object stops momentarily.
a = -10 m s-2 -ve acceleration means it is pointing downwards (upward direction) Back to Equations of Motion 3 Kinematics 2 Click Back to
v = 10 m s-1 a = -10 m s-2 -ve acceleration means it is pointing downwards (upward direction) s = ? t = ? u = 50 m s-1 Back to Equations of Motion 3 Kinematics 2 Click Back to +ve displacement means upward displacement