Download
1 / 86
860 likes | 883 Vues
Learn about signals, analogue and discrete time, sampling techniques, and the basics of digital signal processing for media applications.

E N D
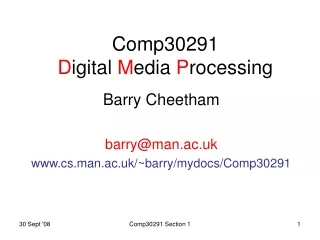
Comp30291Digital MediaProcessing Barry Cheetham barry@man.ac.uk www.cs.man.ac.uk/~barry/mydocs/Comp30291 Comp30291 Section 1
Section 1 Introduction • Signal: time-varying measurable quantity • whose variation normally conveys information. • Quantity often a voltage obtained from some transducer • e.g. a microphone. • Define two types of signal: • Continuous time (analogue) • Discrete time Comp30291 Section 1
Voltage Voltage 5 1 t t -0.1 0.1 • Analogue signals • Continuous variations of voltage. • Exist for all values of t in range - to +. • Examples: • (i) 5sin(62.82t) : • sine-wave of frequency 62.82 radians/second ( 10 Hz) Graph of voltage against time gives continuous 'waveform' : Comp30291 Section 1
‘Sound’ • Variation in air pressure • May be generated by musical instruments or a human voice. • E.g. by a piano string vibrating or your vocal cords vibrating • Local pressure variation travels thro’ the air to your ear or a microphone. • There it causes a ‘diaphragm’ to vibrate. • Microphone produces a continuous voltage proportional to the variation in air pressure. • Graph of voltage against time is ‘sound waveform’. Comp30291 Section 1
closetoNewcastle.pcm 0.8 0.6 0.4 0.2 voltage 0 -0.2 -0.4 -0.6 -0.8 -1 0 0.5 1 1.5 time in seconds Segment of telephone speech: ‘Its close to Newcastle’ Comp30291 Section 1
cap4th.wav (mono) 1 0.8 0.6 0.4 0.2 voltage 0 -0.2 -0.4 -0.6 -0.8 -1 0 2 4 6 8 10 12 14 16 time in seconds 16 s segment of violin music Comp30291 Section 1
Violin note before sampling 0.8 0.6 0.4 0.2 voltage 0 -0.2 -0.4 -0.6 0 0.005 0.01 0.015 0.02 0.025 0.03 0.035 0.04 0.045 0.05 time in seconds 50ms segment of music: violin note What is frequency of note being played? Ans 16 cycles in 0.05 s 320 Hz Comp30291 Section 1
Discrete-time signal • Exists only at discrete points in time. • Often obtained by sampling an analogue signal, • i.e. measuring its value at discrete points in time. • Sampling points separated by equal intervals of T seconds. • Given analogue signal x(t), x[n] = value of x(t) when t = nT. • Sampling process produces a sequence of numbers: • { ..., x[-2], x[-1], x[0], x[1], x[2], ..... } • Referred to as {x[n]} or ' the sequence x[n] '. • Sequence exists for all integer n in the range - to . Comp30291 Section 1
Examples of discrete time signals: (i) {..., -4, -2, 0, 2, 4, 6, ....} sequence whose nth element, x[n], is defined by : x[n] = 2n. Underline sample corresponding to n = 0. (ii) { ..., -4.75, -2.94, 0, 2.94, 4.75, 4.76, ...} sequence with x[n] = 5 sin(62.82t) with t=nT and T=0.01. (iii) { ..., 0, ..., 0. 0, 1, 1, 1, ..., 1, ...} “ unit step ” sequence whose nth element is: 0 : n < 0 u[n] = 1 : n 0 Comp30291 Section 1
x[n] 2 - n -3 -2 -1 1 2 3 4 -2- Graphs of discrete time signals For Example (i): Comp30291 Section 1
For Example (ii): x[n] 3 - -3 -2 -1 1 2 3 4 -3 Graphs of discrete time signals n Comp30291 Section 1
Graphs of discrete time signals For Example (iii): x[n] 1 - n -3 -2 -1 1 2 3 4 -1- Comp30291 Section 1
4 closetoNewcastle.pcm x 10 2 1.5 1 0.5 16-bit binary number 0 -0.5 -1 -1.5 -2 -2.5 -3 0 2000 4000 6000 8000 10000 12000 sample index n Speech sampled at 8kHz with 16 bits per sample Comp30291 Section 1
45 ms segment of music sampled at 22.05 kHz Frequency of note 19/1000 = 0.019 cycles/sample = 0.019 *22050 = 419 Hz Comp30291 Section 1
Violin note sampled at 22050 Hz 4 x 10 3 2 16-bit binary number 1 0 -1 -2 -3 0 100 200 300 400 500 600 700 800 900 1000 1100 sample index n 50 ms segment of music sampled at 22.05 kHz What’s the frequency now, folks? Comp30291 Section 1
4 x 10 16-bit binary number 2 1.5 1 0.5 0 -0.5 -1 -1.5 -2 n 0 500 1000 1500 Voiced telephone speech sampled at 16000 Hz Short ( 100ms) segment of a vowel. [1ms = 1/1000 second] Vowels are approximately periodic. What is the pitch of the voice here? Ans: 9 cycles in 1/10 s i.e. 90 Hz - probably male speech Comp30291 Section 1
Digital signal • Discrete time signals often generated byADC devices. • Produce binary numbers from sampled voltages or currents. • Accuracy determined by 'word-length ' of ADC device, • i.e. number of bits available for each binary number. • Quantisation: Truncating or rounding sampled value to nearest available binary number • Resulting sequence of quantised numbers is a digital signal. . • i.e. discrete time signal with each sample digitised for arithmetic processing. Comp30291 Section 1
Signal Processing • Analogue signals "processed" by circuits consisting of resistors, capacitors, transistors etc. • Digital signals "processed" using programmed computers, microcomputers or special purpose digital hardware. • Examples of the type of processing that may be carried out are: • (i) amplification or attenuation. • (ii) filtering out some unwanted part of the signal. • (iii) rectification : making waveform purely positive. • (iv) multiplying by another signal. Comp30291 Section 1
‘Real time’ & ‘non-real time’ processing • ’Real time' processing: • A mobile phone contains 'DSP' processor fast & powerful enough to perform the mathematical operations required to process digitised speech as it is being received. • ‘Non-real time’ processing: • A PC can perform DSP processing on a stored recording of music. • It can take as much time as it needs to complete this processing. • Useful in its own right; e.g for MP3 compression. • Also used to 'simulate' software for real time DSP systems before they are built into special purpose hardware. • Simulated DSP systems tested with stored segments of speech/music. Comp30291 Section 1
Introduction to ‘MATLAB’ • High level computing language for matrix operations. • Widely used for studying signal processing & comms. • No need to declare variables in advance. • Each variable may be array with real or complex elements. • No distinction between reals & integers Comp30291 Section 1
Examples of MATLAB statements A = [ 1 2.8 3.2 4 5 6 7.7 8 ] ; X = [ 1 2 3 4 ] ; Y = [ 1 2 3 4 ] ; Z = 3 ; W = 4 + 5.5j ; % Comment Comp30291 Section 1
5 0 -5 0 10 20 30 40 50 60 70 80 Generating, storing & plotting signals Generate & plot 80 samples of a 10 Hz sine-wave of amplitude 5, sampled at 100 Hz: clear all; T = 0.01; % sampling interval (seconds) for n=1:80 s(n) = 5*sin(2*pi*10*n*T); end; plot (s); Comp30291 Section 1
Signals in MATLAB Segments in row or column ‘vector’ arrays: n x 1 or 1 x n matrices. Previous example produces row vector s To produce column vector s containing sine-wave segment for n = [1:100]’ s(n) = sin(n*pi/10) end; Another (preferred) way of defining column vector s: n=[1:100]’ ; % 100x1 col vector with entries 1,2,...,100 s(n) = sin(n*pi/10) % For each entry of n, calculate value. Comp30291 Section 1
Row-vectors & column-vectors x = [ 1.1, 2, 3.3, 4, 5 ] defines row vector x = [ 1.1; 2; 3.3; 4; 5 ] defines column vector. Easier to write than: x = [ 1.1 2 3.3 4 5 ] Comp30291 Section 1
Transpose • x.' is transpose of x. (Note the .' symbols). • If x is col vector, x.' will be row vector. • Note dot apostrophe (.') rather than simply apostrophe ('). • Omitting dot will give “complex conjugate transpose”. • Index of first element of a row or column vector is always one. • Sometimes inconvenient since a signal starts at time zero. • Frequency spectrum normally starts at frequency zero. • Consider adopting following statements: • for n = 0 : 1023 • x(1+n) = sin(n*pi/10) • end; • Preserves natural definition of n as time-index. Comp30291 Section 1
Command line mode • Run MATLAB by clicking on icon & type in statements. • If in doubt about any command, e.g. ‘plot’ type: help plot <return >> 4 + 5 >> X=4;Y=5; X+Y >> X*Y >>X/Y >> bench (Tells you how fast your computer is) >> for n = 0 : 99 >> x(1+n) = sin(n*pi/10) >> end; >> plot(x) Comp30291 Section 1
Scripting ‘m-files’ • More convenient to have statements in script file e.g. myprog.m. • Just a text file often referred to as an "M-file". • To execute the statements in "myprog.m" just type • "myprog" • MATLAB has a text editor. • Paths must be set to a "work" directory • where the "M-files" will be stored. Comp30291 Section 1
Digital media file formats • Confusing number of different ways of storing speech, music, images & video in digital form. Consider just six: • ‘*.pcm’ or ‘*.raw’: binary file without header often used for uncompressed ‘narrowband’speech sampled at 8 or 16 kHz. • ‘*.wav’: binary file with header often used uncompressed high-fidelity stereo sound (music or speech) sampled at 44.1 kHz. • ‘*.mp3’ for mp3 compressed music or hi-fi speech. • ‘*.tif’ files for images with lossless compression. • ‘*jpg’ files for images with lossy compression • ‘*.avi’ audio/video interleaved files. Comp30291 Section 1
MATLAB functions for reading/writing *.pcm % Open *.pcm file of 8 kHz sampled speech,16 bits/sample IFid=fopen('operamp.pcm','rb'); inspeech = fread(IFid, 'int16'); L = length(inspeech); % number of samples scale = max(abs(inspeech)) + 1; sound(outspeech/scale,8000,16); % listen to the speech outspeech = inspeech / 2; % reduce by 6 dB OFid = fopen(‘opout.raw’, ‘wb’); fwrite(OFid,outspeech, ‘int16’); fclose('all'); Comp30291 Section 1
MATLAB functions for reading/writing *.wav clear all; close all; % closes all graphs etc. [inmusic, Fs, Nbits] = wavread('cap4th.wav'); S=size(inmusic); % inmusic may be mono or stereo L=S(1); % number of mono or stereo samples if S(2) ==2 disp(‘music is stereo’); end; sound(inmusic,Fs,Nbits); outmusic = inmusic /sqrt(2); % reduce amplitude by 3 dB wavwrite(outmusic, Fs, Nbits,’outfile.wav’); fclose (‘all’); % closes all files Comp30291 Section 1
Another way of saving/loading arrays • Does not produce files that can be read by wave-editors, though it can produce text files. • To save an array called "b" in a disk file called "bits.dat": save bits.dat b -ascii • Omitting ‘-ascii’ creates a more compact ‘non-ascii’ binary file. • To read contents of ascii file ‘bits.dat’ into array called ‘bits’: load bits.dat -ascii Comp30291 Section 1
Frequency spectrum & sampling • A sine-wave has a ‘frequency’( f ) in Hz or 2f radians/second. • Sine-waves do not sound very nice. • Speech & music need of lots of sine-waves added together. • Harmonically related, i.e. f, 2f, 3f, 4f, 5f, ... • Other sounds approximated as sum of lots of very small sine-waves. • Any type of signal has a ‘frequency spectrum’. • Most energy in speech is within 300 Hz to 3400 Hz (3.4 kHz). • Energy in music that we can hear is in range 50 Hz to 20 kHz. Comp30291 Section 1
Spectral analysis of a sine-wave x(t)=Asin(2Ft) is sine-wave of frequency F Hz All its power is concentrated at F Hz. Its power spectrum is infinitely high line at f=F. Draw upward arrow & call it an ‘impulse’. Its ‘strength’ is A2/2 watt/Hz for Asin(2Ft) Can make length of line strength but must put arrow on top. Powerspectral density A2/2 f Hz F Comp30291 Section 1
Spectral analysis of musical note • ‘Fundamental’ sine-wave at F Hz • & lots of sine-wave ‘harmonics’ at 2F, 3F, etc. • F is ‘note’: 440 Hz for ‘A’, 266 Hz for ‘mid C’ • What is the note being played here? • 910 Hz ( Just above ‘top A’). Powerspectral density f Hz F 20 kHz Comp30291 Section 1
Spectral analysis of analogue signals • Spectral analysis of periodic sound before it is sampled is tricky because of the upward arrows. • They are infinitely high!! • We plotted their ‘strengths’, not their amplitudes. • Things become easier when we spectrally analyse digitised sound (later)! Comp30291 Section 1
‘Sampling Theorem’ • If a signal has all its spectral energy below B Hz, & is sampled at Fs Hz where Fs≥2B, it can be reconstructed exactly from the samples. • Speech below 3400 Hz can be sampled at 6800 Hz (in practice 8 kHz). • Music can be sampled at 40 kHz (in practice 44.1 kHz). • When we process a sampled signal in MATLAB & sampling rate was Fs Hz, we can only observe frequencies in range 0 to Fs/2. Comp30291 Section 1
‘Aliasing’ • What happens if you sampled a speech or music signal at Fs & it has some spectral energy above Fs/2 ? • Leads to a form of distortion known as ‘aliasing’ which sounds very bad. • Must filter off all spectral energy at & above Fs/2 Hz before sampling at Fs. Comp30291 Section 1
MATLAB Signal Processing toolbox • Set of functions for: • (i) carrying out operations on signal segments stored in vectors • (ii) evaluating the effect of these operations, and • (iii) computing parameters of digital filters etc. • Two commonly used operations are: • Digital filtering • Spectral analysis Comp30291 Section 1
Gain 1 f Fc Fs/2 Digital filtering • Low-pass digital filters, high-pass and other categories • Remove or enhance frequency components of a sampled signal. • Low-pass filter aims to ‘filter out’ spectral energy above cut-off frequency Fc, keeping all spectral energy below Fc unchanged. • Only consider frequencies up to Fs/2 . ‘Gain’ frequency-response graph for ideal low-pass digital filter. Comp30291 Section 1
Gain ‘Gain’ frequency-response graph for ideal high-pass digital filter: 1 f Fc Fs/2 Ideal high-pass digital filter • Aims to ‘filter out’ spectral energy below cut-off frequency Fc, keeping all spectral energy above Fc unchanged. • Only consider frequencies up to Fs/2 . Comp30291 Section 1
Gain 1 f FL Fs/2 Ideal band-pass digital filter • Aims to ‘filter out’ spectral energy below frequency FL, & above FH keeping all spectral energy between FL & FH unchanged. • Only consider frequencies up to Fs/2 . ‘Gain’ frequency-response graph for ideal band-pass digital filter: FH Comp30291 Section 1
Ideal band-stop digital filter • Aims to ‘filter out’ spectral energy between FL, & FH keeping all spectral energy below FL & above FH unchanged. • Only consider frequencies up to Fs/2 . ‘Gain’ frequency-response graph for ideal band-stop digital filter: Comp30291 Section 1
Gain ‘Gain’ frequency-response graph for ideal band-stop digital filter: 1 f FL FH Fs/2 Ideal band-stop digital filter • Aims to ‘filter out’ spectral energy between FL, & FH keeping all spectral energy below FL & above FH unchanged. • Only consider frequencies up to Fs/2 . Comp30291 Section 1
IIR & FIR digital filters • There are 2 types of digital filter: Infinite impulse response (IIR) type. Finite impulse response (FIR) type. • Either can be low-pass, high-pass, band-pass etc. • MATLAB can design both types by many different methods. Comp30291 Section 1
Gain-response of typical IIR low-pass filter in practice • Previous graph shown ‘ideal response’. • Referred to as ‘brick-wall’. • In practice cut-off is more gradual as illustrated here. GAIN 1 FREQUENCY fC Fs/2 Comp30291 Section 1
Same gain-response now in deciBels • Plot 20*log10(GAIN) against freq • Absolute gain of 0 is 0 dB. • Absolute gain of 0 is - dB. GAIN (dB) 0 -10 -20 -30 FREQUENCY -40 Fs/2 fC Comp30291 Section 1
Decibel scale • Gain is often converted to deciBels (dB) • Gain in dB = 20 log 10 (Absolute Gain) dB Absolute 0 1 6 2 -6 1/2 3 2 20 10 40 100 Comp30291 Section 1
Some of the signal processing functions provided y = filter(a, b, x) ; % Pass x thro’ digital filter to produce y. Coefficients in vectors a and b determine the filter’s effect. For an FIR filter, b=1. The filter has a ‘transfer function’ which is: a(1) + a(2)z-1 + a(3)z-2 + ... H(z) = 1 + b(2)z-1 + b(3)z-2 + ... freqz(a,b); % Display gain & phase responses of digital filters:- % Note the 'zoom' function. [a,b] = butter(n, fC/(Fs/2)); % Get a & b for nth order low-pass filter. Comp30291 Section 1
More functions for designing digital filters [a,b] = butter(n, fc/(Fs/2), ‘high’); % High-pass Butt IIR. [a,b] = butter(n, [fL fU]/(Fs/2) ); % Band-pass Butt IIR. [a,b] = butter(n, [fL fU]/(Fs/2),’stop’); % Band-stop Butt IIR [a,b] = cheby1(n, Rp,fc/(Fs/2) );% Low-pass Chebychev type 1. [a,b] = cheby2(n, Rs,.. ); % Low-pass Chebychev type 2. a = fir1(n, fc/(Fs/2)); % Get 'a' coeffs of FIR low-pass filter order n. % Cut-off is fc. a = fir1(n, (fL, fU]/(Fs/2) ); % FIR band-pass filter design. Many more exist. Comp30291 Section 1
Specifying the cut-off frequencies • This is a bit cumbersome. • If the cut-off is Fc, must enter: Fc / (Fs/2) i.e. divide by half the sampling frequency! Comp30291 Section 1