Discrete and Continuous Data
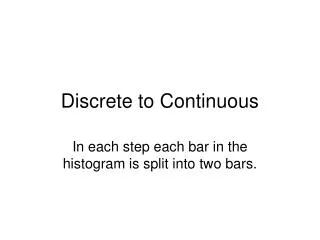
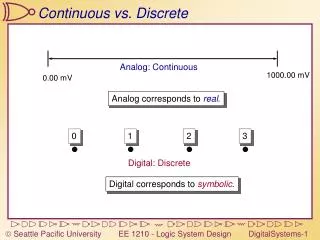
When creating graphs, it's crucial to identify whether you are dealing with discrete or continuous data. Discrete data consists of distinct categories with no meaningful values in between, such as shoe sizes or bus numbers. In contrast, continuous data refers to measurable quantities where gaps have significance, like height or time. Discrete data is typically represented with scatterplots to highlight specific points, whereas continuous data is best shown with line graphs to reflect trends over time. This article provides examples to illustrate the key differences.

Discrete and Continuous Data
E N D
Presentation Transcript
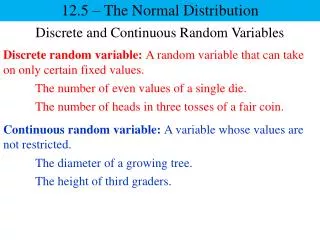
When you draw a graph it is important to decide if you are using discrete or continuous data. Discrete data describes the situation when each category is separate from the others. Examples would be colours, chocolate bars or even number data such as shoe sizes or bus numbers. The important thing is that numbers in between have no meaning – you can have shoe size 6½ but you cannot have size 6¼! Continuousdata describes the situation when you are using a quantity where the gaps in between always mean something. Normally, anything that you measure is continuous, like time, or height With discrete data it is common to draw a scatterplot because you only want to know the information at the exact points you have plotted. With continuous data, you normally draw a line graph because you want to know the information at any time. Discrete and Continuous data
Discrete and Continuous Data • Classify each set of data as discrete or continuous and explain why. • 1) The number of suitcases lost by an airline. • 2) The height of corn plants. • 3) The number of ears of corn produced. • 4) The number of green M&M's in a bag. • 5) The time it takes for a car battery to die. • 6) The production of tomatoes by weight.