STM Heating Automation
STM Heating Automation. ECE 345 Senior Design Project Aditya Vaidya and Kanishk Kejriwal. Scanning Tunneling Microscope Basics. STM is used to scan and generate images of nanostructures It is also a tool for Nanofabrication

STM Heating Automation
E N D
Presentation Transcript
STM Heating Automation ECE 345 Senior Design Project Aditya Vaidya and Kanishk Kejriwal
Scanning Tunneling Microscope Basics • STM is used to scan and generate images of nanostructures • It is also a tool for Nanofabrication • Scanning is usually done at extreme temperatures to ensure absence of redundant microscopic particle
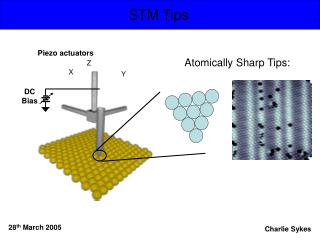
STM - How does it work? • As the tip scans the surface laterally, changes in the shape of the sample are registered as current changes. • Images are generated as piezoelectric motors adjust the height of the tip and maintain an average gap current. http://dpmc.unige.ch/gr_fischer/localprobe.html
Sample Heating • Samples have to be heated to temperatures as high as 1100°C to drive off impurities. • Pressure in the UHV chamber has to be maintained below 1E-9 Torr while heating. • Need to ensure that the pressure and temperature are regulated.
Why Automate? • Someone has to keep checking the parameters. Inaccurate sometimes. • Need a mechanism that regulates the physical parameters while heating.
Proposed Solution • Save time by sending commands in the form of data to power supply. • Labview communicates with devices. • Serial/GPIB communications with devices.
Individual Devices and how they communicate • Varian Multiguage (RS232/Serial) • Sorensen/Agilent Power Supply (GPIB/IEEE488.2) • Minolta Cyclops 52 Pyrometer (RS232/Serial)
Block Diagram of proposed solution Pyrometer Serial/RS232 Multiguage Lab View Power Supply
Specifications • Aim: Maintain Si sample at high temperature without exceeding pressure limit. Between 800C – 1100C • The power supply plays an integral part • Pyrometer specification:Temperature Range: 650C – 2000CError Margin: 2% • Pressure Gauge: Pressure as low as: 1E-18 Error Margin: 5%
Specifications (cont.) • Error margin of Agilent E3631A 2% Error margin of program 5%Resulting error margin of 7.1% Fairly good error margin. • Response time of the program to changes in system:For temperature: 300msFor pressure: ~1s
Sample Specifications • Sample is usually Silicon • Boron doped, p-type • Resistivity 0.01 – 0.03 Ω cm • Total Resistance at room temperature is due to contacts with the holder (~40 Ω)
Advantages of Labview • User friendly interface • Communication with devices made easy • VISA (Virtual Instrument Software Architecture) • Drivers for Power supply available
Program Layout • There are 6 main parts of the program: -Main Controller -Power Initialize -Pressure Monitor -Temperature Monitor -Current Change Calculator -Power Controller • Highly modular design
Visa User Input Area Program Status Output User interface Easy to follow Not too many controls
VI Design • The Main VI communicates with all the devices using several sub-VIs • Two nested loops • Once the process has been run for required time, it shuts
Power Initialize VI • Uses the initial resistance of the sample to supply current. • The power output is so small initially that we can assume constant resistance.
Pressure Monitor VI • Following are the cases: Pressure between Desired and critical Pressure below desired Pressure above critical • Increase power only if pressure below desired • If pressure above critical, reduce power
Temperature Monitor VI • Compares temperature with upper and lower limit. • Power increased only if temperature and pressure are below the range • Power decreased if temperature is beyond range
Current Change VI • Algorithm: We can increase current only if pressure below desired value. We must decrease current if pressure above critical. Reduce current if temp. above desired range. • The change in current is 0.1A which is a suitable step size.
Power Regulator VI • Receives input from the Change calculator • Sets the new value in the supply
Testing Procedure • Power Initializer - Used a potentiometer and supplied a certain current to it. Slowly changed the resistance to observe behavior. • Pressure Gauge - Connected the pressure gauge to a chamber and studied the behavior as the pressure changed due to higher power.
Testing (cont.) • Pyrometer - The pyrometer broke during experimentation hence extenisive tests could not be executed. Tested the basic communication with the device. • Unit testing - Conducted heating experiment on a sample using the program. The program responded perfectly to changes in environment variables and the required temperature was reached.
Results from test • Change in resistance of sample holder • Temperature measurements • Change in pressure of chamber
Challenges • The hardest part of the project was communicating with the devices. • There were significant time delays as the communicated values were always erroneous. • Eventually used the Agilent supply from lab. • Pyrometer stopped working in the middle of the project. Has not been fixed yet.
Future improvements • If parameter data is needed for future reference, an excel worksheet could be added that would store data at regular intervals. • Control the Sorensen power supply with the Agilent using A/D scaling.
Acknowledgments • Professor Joe Lyding for giving us a chance to work on this project • Peter Albrecht and Matt Zettle for STM/Hardware orientation • Mark for helping us with the Power supply, the central device in this Project.