Background knowledge expected
This lecture focuses on the intricacies of population growth models, specifically exponential, geometric, and logistic growth equations. We will explore ecological processes that impact small populations, delving into factors like habitat loss, pollution, and demographic stochasticity. Key concepts such as Allee effects, environmental variation, and genetic variation in fragmented habitats will be discussed. We'll also analyze deterministic vs. stochastic population growth, and the implications of climate change on population dynamics based on real-world examples, including gray whale populations.
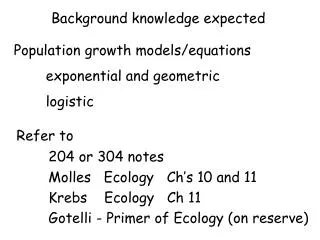

Background knowledge expected
E N D
Presentation Transcript
Background knowledge expected Population growth models/equations exponential and geometric logistic Refer to 204 or 304 notes Molles Ecology Ch’s 10 and 11 Krebs Ecology Ch 11 Gotelli - Primer of Ecology (on reserve)
The ecology of small populations Habitat loss Pollution Overexploitation Exotic spp Small fragmented isolated popn’s Env variation Inbreeding Genetic Variation Demographic stochasticity Reduced N Genetic processes Catastrophes Stochastic processes
Outline for this weeks lectures • How do ecological processes impact small populations? • Stochasticity and population growth • Allee effects and population growth
Demography has four components Birth (Natality) + Emigration - Immigration + Population Nt Death (Mortality) - Nt+1 = Nt +B-D+I-E
Exponential population growth (population well below carrying capacity, continuous reproduction closed pop’n) ∆N ∆t Change in population at any time dN = (b-d) N = r N where r =instantaneous rate of increase dt Cumulative change in population Nt = N0ert N0 initial popn size, Nt pop’n size at time t e is a constant, base of natural logs
Trajectories of exponential population growth N Trend r > 0 r = 0 r < 0 t
Geometric population growth (population well below carrying capacity, seasonal reproduction) Nt+1 = Nt +B-D+I-E ∆N = Nt+1 - Nt = Nt +B-D+I-E - Nt = B-D+I-E Simplify - assume population is closed; I and E = 0 ∆N = B-D If B and D constant, pop’n changes by rd = discrete growth factor Nt+1 = Nt +rd Nt = Nt (1+ rd) Let 1+ rd = , the finite rate of increase Nt+1 = Nt Nt = t N0
DISCRETE vs CONTINUOUS POP’N GROWTH Reduce the time interval between the teeth and the Discrete model converges on continuous model = er or Ln () = r Following are equivalent r > 0 > 1 r = 0 = 1 r< 0 < 1 Trend
Geometric population growth (population well below carrying capacity, seasonal reproduction) Nt+1 = (1+rdt) Nt = (1+rdt) (1+rdt-1) Nt-1 = (1+rdt) (1+rdt-1) (1+rdt-2) Nt-2 = (1+rdt) (1+rdt-1) (1+rdt-2) (1+rdt-3) Nt-3 Add data rdt = 0.02 rdt-1 = - 0.02 rdt-2 = 0.01 rdt-3 = - 0.01 Nt-3= 10 What is the average growth rate?
= (1+0.02) + (1-0.02) + (1+0.01) + (1-0.01) = 1 4 Geometric population growth (population well below carrying capacity, seasonal reproduction) What is average growth rate? Arithmetic mean Predict Nt+1 given Nt-3 was 10
Geometric population growth (population well below carrying capacity, seasonal reproduction) What is average growth rate? Geometric mean = [(1+0.02) (1-0.02) (1+0.01) (1-0.01)]1/4 = 0.999875 Calculate Nt+1 using geometric mean Nt+1 = 4 x 10 (0.999875)4 x10 = 9.95 Nt+1 = (1+0.02) (1-0.02) (1+0.01) (1-0.01) 10 = 9.95 KEYPOINT Long term growth is determined by the geometric not the arithmetic mean Geometric mean is always less than the arithmetic mean
DETERMINISTIC POPULATION GROWTH For a given No, r or rd and t The outcome is determined Eastern North Pacific Gray whales Annual mortality rates est’d at 0.089 Annual birth rates est’d at 0.13 rd=0.13-0.89 = 0.041 = 1.04 1967 shore surveys N = 10,000 Estimated numbers in 1968 N1= N0 = ? Estimated numbers in 1990 N23= 23 N0 = (1.04)23. 10,000 = 24,462
DETERMINISTIC POPULATION GROWTH For a given No, r or rd and t The outcome is determined
Population growth in eastern Pacific Gray Whales • fitted a geometric growth curve between 1967-1980 • - shore based surveys showed increases till mid 90’s In US Pacific Gray Whales were delisted in 1994
SO what about variability in r due to good and bad years? ENVIRONMENTAL STOCHASTICITY leads to uncertainty in r acts on all individuals in same way \ Mean r (∑r)2 = ∑r2 - Variance in r = 2e N N Bad 0 Good b-d
Population growth + environmental stochasticity Deterministic 1+r= 1.06, 2e = 0 Expected Ln N 1+r= 1.06, 2e = 0.05 t Expected rate of increase is r- 2e/2
Predicting the effects of greater environmental stochasticity Onager (200kg) Israel - extirpated early 1900’s - reintroduced 1982-7 - currently N > 100 RS varies with Annual rainfall Survival lower in droughts
Global climate change (GCC) is expected to ----> changes in mean environmental conditions ----> increases in variance (ie env. stochasticity) Data from Negev mean drought < 41 mm Pre-GCC Post-GCC Mean rainfall is the same BUT Variance and drought frequency is greater in “post GCC”
Simulating impact on populations via rainfall impact on RS Variance in rainfall Low High Number of quasi-extinctions = times pop’n falls below 40
Simulating impact on populations adding impact on survival CONC’n Environmental stochasticity can influence extinction risk
But what about variability due to chance events that act on individuals Chance events can impact the breeding performance offspring sex ratio and death of individuals ---> so population sizes can not be predicted precisely Demographic stochasticity
Demographic stochasticity Dusky seaside sparrow subspecies non-migratory salt marshes of southern Florida decline DDT flooding habitat for mosquito control Habitat loss - highway construction six left All male Dec 1990 declared extinct
Extinction rates of birds as a function of population size over an 80-year period 60 10 breeding pairs – 39% went extinct 10-100 pairs – 10% went extinct 1000>pairs – none went extinct * % Extinction 30 * * * * * 0 * * * 1 10 100 1000 10,000 Population Size (no. pairs) Jones and Diamond. 1976. Condor 78:526-549
random variation in the fitness of individuals (2d) produces random fluctuations in population growth rate that are inversely proportional to N demographic stochasticity = 2d/N expected rate of increase is r - 2d/2N Demographic stochasticity is density dependant
How does population size influence stochastic processes? Demographic stochasticity varies with N Long term data from Great tits in Whytham Wood, UK Environmental stochasticity is typically independent of N
Partitioning variance Species2d 2e Swallow 0.18 0.024 Dipper 0.27 0.21 Great tit 0.57 0.079 Brown bear 0.16 0.003 in large populations N >> 2d /2e Environmental stochasticity is more important Demographic stochasticity can be ignored Ncrit = 10 * 2d /2e (approx Ncrit = 100)
Stochasticity and population growth N0= 50 = 1.03 N* Unstable eqm below which pop’n moves to extinction Simulations - = 1.03,2e = 0.04, 2d = 1.0 N* = 2d /4 r - (2e /2)
SUMMARY so far • Environmental stochasticity • fluctuations in repro rate and probability of mortality imposed by good and bad years • act on all individuals in similar way • Strong affect on in all populations • Demographic stochasticity • chance events in reproduction (sex ratio,rs) or survival acting on individuals • strong affect on in small populations • Catastrophes • unpredictable events that have large effects on population size (eg drought, flood, hurricanes) • extreme form of environmental stochasticity Stochasticity can lead to extinctions even when the mean population growth rate is positive
Key points Population growth is not deterministic Stochasticity adds uncertainty Stochasticity is expected to reduce population growth Demographic stochasticity is density dependant and less important when N is large Stochasticity can lead to extinctions even when growth rates are, on average, positive