Download
1 / 41
410 likes | 515 Vues
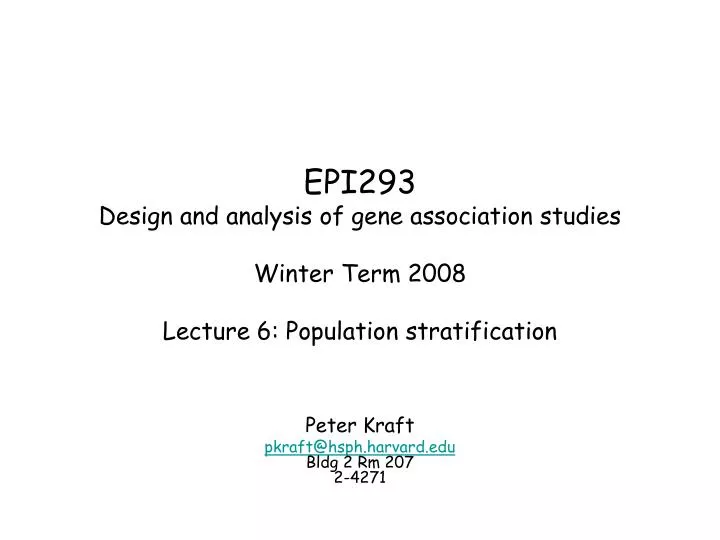
EPI293 Design and analysis of gene association studies Winter Term 2008 Lecture 6: Population stratification. Peter Kraft pkraft@hsph.harvard.edu Bldg 2 Rm 207 2-4271. Population stratification.

E N D
EPI293Design and analysis of gene association studiesWinter Term 2008Lecture 6: Population stratification Peter Kraft pkraft@hsph.harvard.eduBldg 2 Rm 2072-4271
Population stratification • Confounding due to correlated differences in allele frequencies and disease risks across unobserved subpopulations • Extent and impact varies • Likely to be negligible when source population is made up of many subpopulations, small differences in allele freqs and disease risk [e.g. non-Hispanic European Americans] • More likely to be appreciable when source population is made up of [or an admixture of] two subpopulations with larger differences in allele freqs and disease risks [e.g. African Americans, Mexicans, Puerto Ricans]
But degree of Indian heritage is a confounder. When stratified by Indian heritage, no evidence of association between Gm and diabetes was found.
But differences in allele frequencies and disease rates do not always lead to population stratification bias…
Bladder cancer incidence, NAT2 genotype frequencies in 8 European populations Women Degree of confounding depends on In special case of Armitage Trend Test Men Adapted from Wacholder et al. (2000) JNCI 92:1151-1158
Campbell [Nat Genet 2005] found a correlation between alleles in the lactase gene and height in a European-American sample • But they observed strong trends in both LCT allele frequency and height with respect to North-South European grand-parental ancestry The association between the LCT SNP and height in the total sample was strong (p<10-6). The association was weakened when data were stratified by grandparental ancestry. It disappeared when tested in two independent, ethnically homogeneous studies, one in Poland and one in Sweden (the latter being a family-based study). Voila, population stratification bias in a European American population. But how common is this? Does it mean we should estimate and adjust for population stratification in studies of U.S. whites?
a) Evidence against population stratification b) Potential for population stratification—but gradient in allele frequencies should follow gradient in phenotype What’s missing from this argument?
Adjusting for X unnecessary or insufficient; can even reduce power G D X Population structure,no confounding G D X Population structure,potential confounding G D X No population structure,no confounding
What to do? • Match on ethnic ancestry • Self report may not be accurate • Ethnicity [e.g. “race”] may not be good surrogate for ancestry • Difficult to match mixed ancestry subjects • Adjust using multiple unlinked markers • “Structured association” • Use markers to test for and assign individuals to latent classes • Most popular software: STRUCTURE (J Pritchard) • “Genomic control” • Estimate “test statistic inflation” and adjust accordingly • Adjust for multiple random, unlinked markers • Surrogate for genetic variation across subpopulation • Most popular software: EIGENSTRAT (A Price, N Patterson) • Use family-based controls • Siblings (conditional logistic) • Case-parent “pseudocontrols” (TDT, FBAT etc.)
Self report of ethnicity is a good surrogate for gross differences in ancestry… Clusters based on 326 microsatellites Am. J. Hum. Genet., 76:268-275, 2005
ILLUMINA 550K AFFYMETRIX 500K Selection of a set of SNPs for population stratification ILLUMINA 317K Remove SNPs with call rate < 90% on either Illumina or Affymetrix platform 50 374 SNP Remove untyped or monomorphic SNPs in YRI or (JPT+CHB) 40 829 SNP Remove SNPs with P-values for HW proportion < 0.01 Select a set of SNPs with local parwise r2 < 10-3 10 095 SNPs Slide courtesy of G Thomas
A model of a structured population Population studied : Europe : CEPH founders => 60 individuals HapMap African : YRI founders => 59 individuals HapMap Asian : CHB => 44 individuals HapMap Asian : JPT => 45 individuals HapMap Native American : Mexican => 30 individuals Penn State U.* Native American : Mayan => 25 individuals Penn State U.* African Americans => 15 individuals Penn State U.* "Latino" => 7 individuals SNP500 Total of 285 individuals Slide courtesy of G Thomas *Courtesy of X. Mao , E. Parra and M. Shriver
First to third components .6 YRI YRI .4 African American African American First principal component First principal component .2 CEU CEU 0 Latino CHB, JPT Latino Native American -.2 Native American CHB, JPT .3 -.2 .2 .1 0 .2 .4 0 -.2 -.1 Second principal component Third principal component Slide courtesy of G Thomas
0.15 1st PC ATBC=Finns 0.1 0.05 0 -0.05 -0.1 -0.05 0 0.05 0.1 2nd PC But cannot capture within-ethnicity variation… Plot of 1st and 2nd principal components of variation for ca. 10,000 self-described European(-descended) subjects in the CGEMS prostate cancer GWAS
Structured Association • Genotype multiple unlinked, anonymous markers • Very unlikely to be (or be near) causal loci • Best to choose ancestry informative markers (AIMs) • Known for African, European, native American populations • Not known to distinguish among European populations • To test for strat’n, sum disease-marker chi-squares • This sum has d.f. = sum of individual tests’ d.f. • Use clustering algorithm to estimate structure • STRUCTURE, ADMIXMAP based on pop’n genetics models • Structure does not assume allele freqs in ancestral popn’s known • Admixmap does • Use estimated admixture as covariates or matching vars Pritchard & Rosenberg (1999) AJHG 65:200-228 Pritchard et al. (2000) Genetics 155:945-959
Toy example • 150 subjects from Pop’n 1 • Disease incidence 15% • 150 markers with allele freqs ~ Beta(1,10) • Allele freqs, markers independent of disease • 150 subjects from Pop’n 2 • Disease incidence 30% • 150 markers with allele freqs ~ Beta(1,10) • Allele freqs, markers independent of disease
Pop’n stratification appears to inflate Type I error rate… Adjustment=appropriate stratified analysis … but test for stratification Sum chi-squares = 177.00 on 150 d.f. p =.065
Still, there is strong evidence that there are two distinct subpopulations. http://pritch.bsd.uchicago.edu/structure.html
In practice, STRUCTURE is applied to a “spiked” data set (your data plus three HapMap samples) to detect gross outliers or data handling errors Admixture proportions for subjects from 1st and 2nd stages of CGEMS prostate scan Based on that same panel of 10,000 markersThomas et al, submitted
Drawbacks to structured assocation • Computationally intensive • Markers should be unlinked • Model-based • User has to specify number of ancestral populations
Genomic control • For modest pop’n stratification, test stat X dist’n is roughly =2 • So why not estimate (a.k.a. ) to get X* = X/?
Nature Genetics36, 388 - 393 (2004) How many markers needed?
Nature Genetics36, 388 - 393 (2004) Likelihoods for inflation factors for studies with 1000 cases and controls
Genomic control corrects this kind of distortion… … but not this But setting practical problems aside, is genomic control the right thing to do? • Population stratification bias • Under null, Armitage trend test X2 is distributed as: • Cryptic relatedness • Under null, -1 X2 is distributed as 12(0) 12(ξ), where ξ = NΔ2/(22) where = 1+(a11-a01)2 2 f N/(1+f) A Whittemore, unpublished MS
Adjusting for many random markers • Unlike genomic control: • Doesn’t penalize the innocent for the sins of the guilty • Does a better job penalizing the guilty • Variants: • Price: use Principal Components to summarize many markers • Can use clever computational trick (Tracy-Wisdom statistic: Patterson 2007 PLOS Genet) to decide how many components, or just eyeballs PC plots • Adjust for these structure-related PCs • Wang/Balding: adjust for SNPs in non-candidate genes • Epstein & Satten: Wang/Balding meets propensity score
Clear Population Stratification BiasQ-Q plot for NHS Hair Color Scan Black line: unadjusted. Red line: adjusted for top four PCs -log10 p-value λ=1.24λ=1.02
No Clear Population Stratification BiasQ-Q plot for Prostate Cancer Scan
CGEMS prostate cancer example • Not a surprise? • Empiric evidence of subtle genetic differences across region even in U.S. self-described whites is mounting… • …and there is some evidence of variation in prostate cancer rates across regions… • … but (a) the latter pattern is complex and its causes are unclear, and (b) the chance that the two patterns would coincide is small.
Caveats: Not a Foolproof Panacea • Rule of thumb: need at least 1,000 markers • Much more is better! • Linked markers can distort PCs • Will not rescue poor design
Prostate Cancer - Population Structure BPC3 12 Sub-cohorts
1 Japanese Sub-cohort 1 Hawaiian Sub-cohort 1 Latino Sub-cohort 2 African American Sub-cohorts
Red=cases Black=Controls Tough to fix using naïve application of EIGENSTRAT(better to match cases and controls on inferred ancestry, cf PLINK IBD matching or K Roeder [in preparation?])
Pop’n strat’n bias: to recap • A concern for recently admixed populations • Less of a concern for U.S. non-Hispanic Europeans • Still, with large sample sizes small effects will be detected • May affect many markers across genome • Good study design can avoid worst bias • Genomic control may help • Difficult to callibrate for small p-value thresholds, • Can be too conservative or too anti-conservative, depending on (unknown) degree of pop’n strat’n • Structured association intuitive and effective • But performance greatly enhanced by use of AIMs… • …in absence of AIMs, degree of stratification overestimated References Pritchard & Rosenberg (1999) AJHG 65:200-228 Testing for/estimating structure Pritchard et al. (2000) Genetics 155:945-959 Testing for/estimating structure Devlin & Roeder (1999) Biometrics 55:997-1004 Genomic controlBacanu et al. (2000) AJHG 66:1933-1944 Genomic controlWacholder et al. (2000) JNCI 14:1151-1158 Extent of pop’n strat’n Reich et al. (2001) Genet Epidemiol 20:4-16 Genomic controlThomas & Witte (2002) CEBP 11:505-512 Extent of pop’n strat’nWacholder et al. (2002) CEBP 11:513-520 Extent of pop’n strat’n Freedman et al. (2004) 36:388-393 Genomic controlMarchini et al. (2004) Nat Genet 36:512-517 Extent of pop’n strat’n, genomic control Tang et al. (2005) AJHG 76:268-275 Self-reported ethnicity and genetic structure