Chapter 9 Process Modeling
Chapter 9 Process Modeling. Yong Choi BPA CSUB. Not to be discussed…. Structured English No programming background….does not make sense Decision table Operations management course…. Data and Model synchronization Will take at least 4 weeks … Details of lower than DFD level 0 or 1

Chapter 9 Process Modeling
E N D
Presentation Transcript
Chapter 9Process Modeling Yong Choi BPA CSUB
Not to be discussed… • Structured English • No programming background….does not make sense • Decision table • Operations management course…. • Data and Model synchronization • Will take at least 4 weeks… • Details of lower than DFD level 0 or 1 • Simple taste of DFDs will be enough this time…. • Can take up to a month to taste more of DFDs…
Chapter Nine Process Modeling • Define systems modeling and differentiate between logical and physical system models. • Define process modeling and explain its benefits. • Recognize and understand the basic concepts and constructs of a process model. • Explain when to construct process models and where to store them. • Construct a context diagram to illustrate a system’s interfaces with its work environment. • Identify use cases, external and temporal business events for a system. • Perform event partitioning and organize events in a functional decomposition diagram. • Draw event diagrams and merge those events into a system diagram. • Draw primitive data flow diagrams and describe the elementary data flows and processes in terms of data structures and procedural logic (Structured English and decision tables), respectively.
System Concept • A system exits by taking input from the environment , transforming (processing) input, and release an output • A system may be decomposed (exploded) into subsystems • Output of one subsystem may become the input of other subsystems
Example of Decomposition Diagram SoundStage Entertainment Club
Characteristic System focus Design stability Data organization State of data Data-orientation Operation of Data More stable as data needs change slowly Designed for enterprise Controlled Separating data and processes • Process-orientation • what, when & how to do • Limited due to change in business processes • Designed for individual applications • unstructured
Separating data and processes • Process-oriented approach • An IS development strategy that focuses on how and when data are moved through and transformed by an IS • Sequence of steps in the process-oriented approach: • define problem -> identify necessary decisions -> describe information needs -> determine necessary processing -> specify data needs • Data-oriented approach • An IS development strategy that focuses on the optimal organization of data, not on where or how data are used • Sequence of steps in the data-oriented approach: • define problem -> identify requirements -> develop data model for each user's data -> integrate all the data models into an overall model
Data Flow Diagrams (DFD) • Key points for modeling • How data moves through the organization • Relationships between various data flows • Storage of data • Diagrams also called Process Models
Process Modeling with DFD Process Modeling is a technique for organizing and documenting the structure and flow of data through a system’s processes, and the logic, policies, and procedures to be implemented by a system’s processes. A Data Flow Diagram (DFD) is a graphical modeling tool to depict the flow of data through a system and the work or processing performed by that system. • What’s the system doing
Process Logic • DFDs are effective tools for identifying processes, but are not good at showing all the detail logic inside those processes. • Not always easy to know what the lowest logical level is • However, it is better than: • Flowcharts and Pseudocode (difficult for users to understand).
Flowchart Limitations • Complex logic: Sometimes, the program logic is quite complicated. In that case, flowchart becomes complex and clumsy. • Alterations and Modifications: If alterations are required the flowchart may require re-drawing completely. • Reproduction:As the flowchart symbols cannot be typed, reproduction of flowchart becomes a problem. • The essentials of what is done can easily be lost in the technical details of how it is done.
Pseudocode • This is the pseudocode for a Game of Monopoly, including one person's move as a procedure: Main Procedure Monopoly_Game Hand out each player's initial money. Decide which player goes first. Repeat Call Procedure Monopoly_Move for next player. Decide if this player must drop out. Until all players except one have dropped out. Declare the surviving player to be the winner. Procedure Monopoly_Move Begin one's move. Throw the dice. Move the number of spaces on the board shown on the dice. If the token landed on "Go to Jail," then go there immediately. Else if the token landed on "Chance" or "Community Chest," then draw a card and follow its instructions. Else follow the usual rules for the square (buying property, paying rent, collecting $200 for passing "Go", etc.). End one's move.
Elements of a DFD DE MARCO & YOURDON NOTATIONS External Entity Data Flow Process Data Store
Elements of a DFD GANE & SARSON NOTATIONS (Textbook) External Entity Data Flow 3 Pay Bill Process AP Clerk Data Store
External Entities SUPPLIER • An External Entity is a provider (source) or receiver (sink) of data and information of the system • External agents define the “boundary” or “scope” of a system being modeled.
External Entities … • An external entity (agent) defines a person, organization unit, or other organization that lies outside of the scope of the project but that interacts with the system being studied. • As scope changes, external agents can become processes, and vice versa. • Almost always one of the following: • Office, department, division inside the business but outside the system scope. • An external organization or agency. • Another business or another information system. • One of system’s end-users or managers
Data Stores D1 Accounts Receivable • A data store is an inventory of data. • A data store means “data at rest.” • A data flow means “data in motion.”
Data Stores … • Almost always one of the following: • Persons (or groups of persons): e.g., customer • Places: e.g, cash register • Objects: e.g., product • Events (about which data is captured): e.g., sales • Concepts (about which data is important): e.g., discount • Data stores depicted on a DFD store all instances of data entities(depicted on an ERD)
Data Flows DELIVERY SLIP • A Data Flow represents an input of data to a process, or the output of data from a process. • A data flow may also be used to represent the creation, reading, deletion, or updating of data in a “data store.” • A composite data flow (packet) is a data flow that consists of other data flows. • A Data Flow does not represent a document or a physical good: it represents the exchange of information in the document or about the good
Processes 1 • A Process is a work or action performed on input data flow to produce an output data flow • Use a verb to label the action performed by the process (not the name of person or department who does it as in physical DFD) • A Process must haveat least one input data flow and at least one output data flow. Pay Bill
How to find each one… • External Entities (EE) • people/organizations/things that supply information to or use information from the system • Processes (P) • actions/doing words/verbs • Data Flows (DF) • movement/exchange of information/data between external entities to processes, and processes to processes • Data Stores (DS) • store/record information/data
DFD using Use-Case • The actor that initiates the event • External entities • The use cases • Will be handled by a process • Inputs (or triggers) &outputs and responses • Will become a flow of data ** data store is a result of data flow..thus, need naming creativity… **
DFD Naming Guidelines • External Entity Noun • Data Flow Names of data • Process verb phrase • a system name • a subsystem name • Data Store Noun
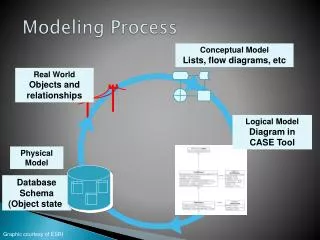
Guidelines for Developing DFD • Develop a list of business activities • Similar to business rules of ERD • Create the Context Diagram (we know this) • shows external entities and data flows to and from the system: conceptual DFD • Create level 0 DFD (or Diagram 0 in textbook) • shows general processes at the highest level • Create level 1 DFD (or Child Diagram in textbook) • shows more detailed processes
Narrative Context Diagram Diagram 0 DFD Diagram 1 DFDs Diagram n DFDs E-R Diagram Process Descriptions DFD Guidelines (con’t)
Apply logical sequence of the system.. • A student (EE) sends in an application form (DF) containing their personal details, and their desired course • The university checks (P) that the course is available. • If the course is available the student is enrolled (P) in the course, and the university confirms (P) the enrolment by sending a confirmation letter (DF) that they are registered for the course to the student. • Or if the course is unavailable the student is sent a rejection letter (DF).
Context DFD Building Procedure • Identify the system and its boundaries (the context) • Identify external entities (providers, receivers of system info) • Identify external data flows (input, output) • However, NO DATA STORE !!! • Note: the whole system itself is a process (it receives input and transforms into output)
Decomposition of Context Diagram M 0 Context Diagram P N Level-0 Diagram M D1 1 2 P 3 Level-1 Diagram N
Where to Begin Creating DFDs • Start with the data flow from an external entity and work forwards • Start with the data flow to an external entity and work backwards • Examine the data flows into or out of a data store • Examine data flows, entity connections and data stores associated with a particular process • Note fuzzy, ill-defined areas of the system for further clarification
Description of Each Level • Context Diagram: This is the highest level and represents the overall system and its interaction with its environment • Level 0 Diagram: This shows the major subsystems and their interactions • Level x Diagram: Shows the processes that make up each of the major subsystems • Level x.y Diagram: Shows detail of the above diagrams
When to Stop • Each process is a single decision or calculation or a single database operation, such as retrieve, update, create, delete or read. • Each data store represents data about a single entity such as a customer, employee, product or order. • The system user does not care to see any more detail or when you and other analysts have dcoumented sufficient detail to do subsequesnt systems development tasks. • Every data flow does not need to be split further to show that different data are handled in different ways. • You believe that you have shown each business form or transaction, computer screen and report as a single data flow. • You believe there is a separate process for each choice on all lowest-level menu options for the system.
Level 0 Tips • Generally move from top to bottom, left to right • Minimize crossed lines • Iterate as needed • The DFD is often drawn many times before it is finished,even with very experienced systems analysts
Level 0 and 1 DFD Building Procedure • Level-0 DFD • Identify what is being done between each input and its corresponding output • Identify the processes • Identify external data flows between external entities and processes • Identify internal data flows between processes and data stores • Level-1 DFD’s • Sub-processes (primitive processes) of Level-0 processes
Tips for Level 1 and Below • Sources for inputs and outputs listed at higher level • List source and destination of data flows to processes and stores within each DFD • Depth of DFD depends on overall system complexity • Two processes generally don’t need lower level • More than seven processes become overly complex and difficult to read
Rules in DFD Building • Rule 1 : Use only DFD notations to avoid confusion • Rule 2 : Use an action VERB to label a process (because a process is an action !!!)
Rules in DFD Building ... • Rule 3 : Must be one process associated with each data flow … M M
Detail Rules in DFD Building ... • Rule 3 : Must be one process associated with each data flow … M N M N
Detail Rules in DFD Building ... • Rule 3 : Must be one process associated with each data flow.
Detail Rules in DFD Building ... • Rule 4 : Shaded corner must appear in ALL occurrences of a duplicated symbol in a same diagram Accounts Receivable CUSTOMER D3 CUSTOMER D3 Accounts Receivable
Detail Rules in DFD Building ... • Rule 5 : No process without output data flow (black hole !!!)
Detail Rules in DFD Building ... • Rule 6 : No process without input data flow (miracle !!!)
Detail Rules in DFD Building ... • Rule 7 : No need for routing (without transforming) a data flow with a process (non value-added activities !!!) Info A Info A