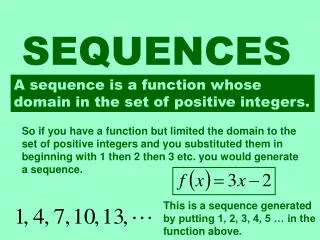
BIOINFORMATICS Sequences
BIOINFORMATICS Sequences. Mark Gerstein, Yale University bioinfo.mbb.yale.edu/mbb452a. Basic Alignment via Dynamic Programming Suboptimal Alignment Gap Penalties Similarity (PAM) Matrices Multiple Alignment Profiles, Motifs, HMMs Local Alignment Probabilistic Scoring Schemes

BIOINFORMATICS Sequences
E N D
Presentation Transcript
BIOINFORMATICSSequences Mark Gerstein, Yale University bioinfo.mbb.yale.edu/mbb452a
Basic Alignment via Dynamic Programming Suboptimal Alignment Gap Penalties Similarity (PAM) Matrices Multiple Alignment Profiles, Motifs, HMMs Local Alignment Probabilistic Scoring Schemes Rapid Similarity Search: Fasta Rapid Similarity Search: Blast Practical Suggestions on Sequence Searching Transmembrane helix predictions Secondary Structure Prediction: Basic GOR Secondary Structure Prediction: Other Methods Assessing Secondary Structure Prediction Features of Genomic DNA sequences Sequence Topics (Contents)
Molecular Biology Information: Protein Sequence • 20 letter alphabet • ACDEFGHIKLMNPQRSTVWY but not BJOUXZ • Strings of ~300 aa in an average protein (in bacteria), ~200 aa in a domain • ~200 K known protein sequences d1dhfa_ LNCIVAVSQNMGIGKNGDLPWPPLRNEFRYFQRMTTTSSVEGKQ-NLVIMGKKTWFSI d8dfr__ LNSIVAVCQNMGIGKDGNLPWPPLRNEYKYFQRMTSTSHVEGKQ-NAVIMGKKTWFSI d4dfra_ ISLIAALAVDRVIGMENAMPWN-LPADLAWFKRNTL--------NKPVIMGRHTWESI d3dfr__ TAFLWAQDRDGLIGKDGHLPWH-LPDDLHYFRAQTV--------GKIMVVGRRTYESF d1dhfa_LNCIVAVSQNMGIGKNGDLPWPPLRNEFRYFQRMTTTSSVEGKQ-NLVIMGKKTWFSI d8dfr__ LNSIVAVCQNMGIGKDGNLPWPPLRNEYKYFQRMTSTSHVEGKQ-NAVIMGKKTWFSI d4dfra_ ISLIAALAVDRVIGMENAMPW-NLPADLAWFKRNTLD--------KPVIMGRHTWESI d3dfr__ TAFLWAQDRNGLIGKDGHLPW-HLPDDLHYFRAQTVG--------KIMVVGRRTYESF d1dhfa_ VPEKNRPLKGRINLVLSRELKEPPQGAHFLSRSLDDALKLTEQPELANKVDMVWIVGGSSVYKEAMNHP d8dfr__ VPEKNRPLKDRINIVLSRELKEAPKGAHYLSKSLDDALALLDSPELKSKVDMVWIVGGTAVYKAAMEKP d4dfra_ ---G-RPLPGRKNIILS-SQPGTDDRV-TWVKSVDEAIAACGDVP------EIMVIGGGRVYEQFLPKA d3dfr__ ---PKRPLPERTNVVLTHQEDYQAQGA-VVVHDVAAVFAYAKQHLDQ----ELVIAGGAQIFTAFKDDV d1dhfa_ -PEKNRPLKGRINLVLSRELKEPPQGAHFLSRSLDDALKLTEQPELANKVDMVWIVGGSSVYKEAMNHP d8dfr__ -PEKNRPLKDRINIVLSRELKEAPKGAHYLSKSLDDALALLDSPELKSKVDMVWIVGGTAVYKAAMEKP d4dfra_ -G---RPLPGRKNIILSSSQPGTDDRV-TWVKSVDEAIAACGDVPE-----.IMVIGGGRVYEQFLPKA d3dfr__ -P--KRPLPERTNVVLTHQEDYQAQGA-VVVHDVAAVFAYAKQHLD----QELVIAGGAQIFTAFKDDV
Raw Data ???T C A T G C A T T G 2 matches, 0 gaps T C A T G | |C A T T G 3 matches (2 end gaps) T C A T G . | | | . C A T T G 4 matches, 1 insertion T C A - T G | | | | . C A T T G 4 matches, 1 insertion T C A T - G | | | | . C A T T G Aligning Text Strings
Dynamic Programming • What to do for Bigger String? SSDSEREEHVKRFRQALDDTGMKVPMATTNLFTHPVFKDGGFTANDRDVRRYALRKTIRNIDLAVELGAETYVAWGGREGAESGGAKDVRDALDRMKEAFDLLGEYVTSQGYDIRFAIEP KPNEPRGDILLPTVGHALAFIERLERPELYGVNPEVGHEQMAGLNFPHGIAQALWAGKLFHIDLNGQNGIKYDQDLRFGAGDLRAAFWLVDLLESAGYSGPRHFDFKPPRTEDFDGVWAS • Needleman-Wunsch (1970) provided first automatic method • Dynamic Programming to Find Global Alignment • Their Test Data (J->Y) • ABCNYRQCLCRPMAYCYNRCKCRBP
Step 1 -- Make a Dot Plot (Similarity Matrix) Put 1's where characters are identical.
A More Interesting Dot Matrix (adapted from R Altman)
Step 2 -- Start Computing the Sum Matrix new_value_cell(R,C) <= cell(R,C) { Old value, either 1 or 0 } + Max[ cell (R+1, C+1), { Diagonally Down, no gaps } cells(R+1, C+2 to C_max),{ Down a row, making col. gap } cells(R+2 to R_max, C+1) { Down a col., making row gap } ]
Step 4 -- Sum Matrix All Done Alignment Score is 8 matches.
Step 5 -- Traceback Find Best Score (8) and Trace BackA B C N Y - R Q C L C R - P MA Y C - Y N R - C K C R B P
Step 5 -- Traceback A B C N Y - R Q C L C R - P MA Y C - Y N R - C K C R B P
Step 6 -- Alternate Tracebacks A B C - N Y R Q C L C R - P MA Y C Y N - R - C K C R B P Also, Suboptimal Aligments
Suboptimal Alignments ; ; Random DNA sequence generated using the seed : -453862491 ; ; 500 nucleotides ; ; A:C:G:T = 1 : 1 : 1 : 1 ; RAN -453862491 AAATGCCAAA TCATACGAAC AGCCGACGAC GGGAGCAACC CAAGTCGCAG TTCGCTTGAG CTAGCGCGCT CCCACCGGGA TATACACTAA TCATTACAGC AGGTCTCCTG GGCGTACAGA CTAGCTGAAC GCGCTGCGCC AATTCCAACT TCGGTATGAA GGATCGCCTG CGGTTATCGC TGACTTGAGT AACCAGATCG CTAAGGTTAC GCTGGGGCAA TGATGGATGT TAACCCCTTA CAGTCTCGGG AGGGACCTTA AGTCGTAATA GATGGCAGCA TTAATACCTT CGCCGTTAAT ATACCTTTAA TCCGTTCTTG TCAATGCCGT AGCTGCAGTG AGCCTTCTGT CACGGGCATA CCGCGGGGTA GCTGCAGCAA CCGTAGGCTG AGCATCAAGA AGACAAACAC TCCTCGCCTA CCCCGGACAT CATATGACCA GGCAGTCTAG GCGCCGTTAG AGTAAGGAGA CCGGGGGGCC GTGATGATAG ATGGCGTGTT 1 ; ; Random DNA sequence generated using the seed : 1573438385 ; ; 500 nucleotides ; ; A:C:G:T = 1 : 1 : 1 : 1 ; RAN 1573438385 CCCTCCATCG CCAGTTCCTG AAGACATCTC CGTGACGTGA ACTCTCTCCA GGCATATTAA TCGAAGATCC CCTGTCGTGA CGCGGATTAC GAGGGGATGG TGCTAATCAC ATTGCGAACA TGTTTCGGTC CAGACTCCAC CTATGGCATC TTCCGCTATA GGGCACGTAA CTTTCTTCGT GTGGCGGCGC GGCAACTAAA GACGAAAGGA CCACAACGTG AATAGCCCGT GTCGTGAGGT AAGGGTCCCG GTGCAAGAGT AGAGGAAGTA CGGGAGTACG TACGGGGCAT GACGCGGGCT GGAATTTCAC ATCGCAGAAC TTATAGGCAG CCGTGTGCCT GAGGCCGCTA GAACCTTCAA CGCTAACTAG TGATAACTAC CGTGTGAAAG ACCTGGCCCG TTTTGTCCCT GAGACTAATC GCTAGTTAGG CCCCATTTGT AGCACTCTGG CGCAGACCTC GCAGAGGGAC CGGCCTGACT TTTTCCGGCT TCCTCTGAGG 1 Parameters: match weight = 10, transition weight = 1, transversion weight = -3 Gap opening penalty = 50 Gap continuation penalty = 1 Run as a local alignment (Smith-Waterman) (courtesy of Michael Zucker)
Suboptimal Alignments II (courtesy of Michael Zucker)
Gap Penalties The score at a position can also factor in a penalty for introducing gaps (i. e., not going from i, j to i- 1, j- 1). Gap penalties are often of linear form: GAP = a + bN GAP is the gap penalty a = cost of opening a gap b = cost of extending the gap by one (affine) N = length of the gap (Here assume b=0, a=1/2, so GAP = 1/2 regardless of length.)
Step 2 -- Computing the Sum Matrix with Gaps new_value_cell(R,C) <= cell(R,C) { Old value, either 1 or 0 } + Max[ cell (R+1, C+1), { Diagonally Down, no gaps } cells(R+1, C+2 to C_max) - GAP ,{ Down a row, making col. gap } cells(R+2 to R_max, C+1) - GAP { Down a col., making row gap } ] GAP =1/2
C R B P C R P M - C R P M C R - P M All Steps in Aligning a 4-mer Bottom right hand corner of previous matrices
ACSQRP--LRV-SH RSENCVA-SNKPQLVKLMTH VKDFCV ACSQRP--LRV-SH -R SENCVA-SNKPQLVKLMTH VK DFCV Key Idea in Dynamic Programming • The best alignment that ends at a given pair of positions (i and j) in the 2 sequences is the score of the best alignment previous to this position PLUS the score for aligning those two positions. • An Example Below • Aligning R to K does not affect alignment of previous N-terminal residues. Once this is done it is fixed. Then go on to align D to E. • How could this be violated? Aligning R to K changes best alignment in box.
Similarity (Substitution) Matrix A R N D C Q E G H I L K M F P S T W Y V A 4 -1 -2 -2 0 -1 -1 0 -2 -1 -1 -1 -1 -2 -1 1 0 -3 -2 0 R -1 5 0 -2 -3 1 0 -2 0 -3 -2 2 -1 -3 -2 -1 -1 -3 -2 -3 N -2 0 6 1 -3 0 0 0 1 -3 -3 0 -2 -3 -2 1 0 -4 -2 -3 D -2 -2 1 6 -3 0 2 -1 -1 -3 -4 -1 -3 -3 -1 0 -1 -4 -3 -3 C 0 -3 -3 -3 8 -3 -4 -3 -3 -1 -1 -3 -1 -2 -3 -1 -1 -2 -2 -1 Q -1 1 0 0 -3 5 2 -2 0 -3 -2 1 0 -3 -1 0 -1 -2 -1 -2 E -1 0 0 2 -4 2 5 -2 0 -3 -3 1 -2 -3 -1 0 -1 -3 -2 -2 G 0 -2 0 -1 -3 -2 -2 6 -2 -4 -4 -2 -3 -3 -2 0 -2 -2 -3 -3 H -2 0 1 -1 -3 0 0 -2 7 -3 -3 -1 -2 -1 -2 -1 -2 -2 2 -3 I -1 -3 -3 -3 -1 -3 -3 -4 -3 4 2 -3 1 0 -3 -2 -1 -3 -1 3 L -1 -2 -3 -4 -1 -2 -3 -4 -3 2 4 -2 2 0 -3 -2 -1 -2 -1 1 K -1 2 0 -1 -3 1 1 -2 -1 -3 -2 5 -1 -3 -1 0 -1 -3 -2 -2 M -1 -1 -2 -3 -1 0 -2 -3 -2 1 2 -1 5 0 -2 -1 -1 -1 -1 1 F -2 -3 -3 -3 -2 -3 -3 -3 -1 0 0 -3 0 6 -4 -2 -2 1 3 -1 P -1 -2 -2 -1 -3 -1 -1 -2 -2 -3 -3 -1 -2 -4 6 -1 -1 -4 -3 -2 S 1 -1 1 0 -1 0 0 0 -1 -2 -2 0 -1 -2 -1 4 1 -3 -2 -2 T 0 -1 0 -1 -1 -1 -1 -2 -2 -1 -1 -1 -1 -2 -1 1 5 -2 -2 0 W -3 -3 -4 -4 -2 -2 -3 -2 -2 -3 -2 -3 -1 1 -4 -3 -2 10 2 -3 Y -2 -2 -2 -3 -2 -1 -2 -3 2 -1 -1 -2 -1 3 -3 -2 -2 2 6 -1 V 0 -3 -3 -3 -1 -2 -2 -3 -3 3 1 -2 1 -1 -2 -2 0 -3 -1 4 • Identity Matrix • Match L with L => 1Match L with D => 0Match L with V => 0?? • S(aa-1,aa-2) • Match L with L => 1Match L with D => 0Match L with V => .5 • Number of Common Ones • PAM • Blossum • Gonnet
+ —> More likely than random 0 —> At random base rate - —> Less likely than random Where do matrices come from? 1 Manually align protein structures(or, more risky, sequences) 2 Look at frequency of a.a. substitutionsat structurally constant sites. -- i.e. pair i-j exchanges 3 Compute log-odds S(aa-1,aa-2) = log2 ( freq(O) / freq(E) ) O = observed exchanges, E = expected exchanges • odds = freq(observed) / freq(expected) • Sij = log odds • freq(expected) = f(i)*f(j) = is the chance of getting amino acid i in a column and then having it change to j • e.g. A-R pair observed only a tenth as often as expected 90% AAVLL… AAVQI… AVVQL… ASVLL… 45%
More on this…. To help us understand the knowledge incorporated in amino acid similarity scores we should briefly look at how they are calculated (4). First we compute an amino acid similarity ratio, Rij for every pair of amino acids i and j. Rij = qij / pipj Where qij is the relative frequency with which amino acids i and j are observed to replace each other in homologous proteins. pi and pj are the frequencies at which amino acids i and j occur in the set of proteins in which the substitutions are observed. Their product, pipj, is the frequency at which they would be expected replace each other if the replacements were random. If the observed replacement rate is equal to the theoretical replacement rate, then the ratio is one ( Rij = qij / pipj = 1.0 ). If the replacements are favored during evolution (i.e. a conservative replacement) the ratio will be greater than one and if there is selection against the replacement the ratio will be less than one. The similarity reported in the evolutionary-based tables for any pair of amino acids i and j, Sij is the logarithm to the base 2 of this ratio, Rij, although it is often scaled by some constant factor. Sij = log2( Rij ) = log2( qij / pipj ) Scores above zero (Sij > 0.0) indicate that two amino acids replace each other more often during evolution than we would expect if the replacements were random. Likewise, scores below zero indicate that amino acids replace each other less often than we would expect if the replacements were random. Thus a positive alignment score means that the pattern of identities and substitutions described by an alignment are more likely to result from previously observed evolutionary processes than to result from random replacements.
1978 1991 L 0.085 0.091 A 0.087 0.077 G 0.089 0.074 S 0.070 0.069 V 0.065 0.066 E 0.050 0.062 T 0.058 0.059 K 0.081 0.059 I 0.037 0.053 D 0.047 0.052 R 0.041 0.051 P 0.051 0.051 N 0.040 0.043 Q 0.038 0.041 F 0.040 0.040 Y 0.030 0.032 M 0.015 0.024 H 0.034 0.023 C 0.033 0.020 W 0.010 0.014 Amino Acid Frequencies of Occurrence
Principles of Scoring Matrix Construction, in detail • The Dayhoff Matrix: Proteins evolve through a succesion of independent point mutations, that are accepted in a population and subsequently can be observed in the sequence pool. (Dayhoff, M.O. et al. (1978) Atlas of Protein Sequence and Structure. Vol. 5, Suppl. 3 National Biomedical Reserach Foundation, Washington D.C. U.S.A). • First step: Pair Exchange Frequencies • A PAM (Percent Accepted Mutation) is one accepted point mutation on the path between two sequences, per 100 residues.
Principles of Scoring Matrix Construction, in detail #2 • Third step: Relative Mutabilities • Relative mutabilities of amino acids: • 1978 1991 • A 100 100 • C 20 44 • D 106 86 • E 102 77 • F 41 51 • G 49 50 • H 66 91 • I 96 103 • K 56 72 • L 40 54 • M 94 93 • N 134 104 • P 56 58 • Q 93 84 • R 65 83 • S 120 117 • T 97 107 • V 74 98 • W 18 25 • Y 41 50 • All values are taken relative to alanine, which is arbitrarily set at 100. • Second step: Frequencies of Occurrence • Amino acid frequencies: • 1978 1991 • L 0.085 0.091 • A 0.087 0.077 • G 0.089 0.074 • S 0.070 0.069 • V 0.065 0.066 • E 0.050 0.062 • T 0.058 0.059 • K 0.081 0.059 • I 0.037 0.053 • D 0.047 0.052 • R 0.041 0.051 • P 0.051 0.051 • N 0.040 0.043 • Q 0.038 0.041 • F 0.040 0.040 • Y 0.030 0.032 • M 0.015 0.024 • H 0.034 0.023 • C 0.033 0.020 • W 0.010 0.014
Principles of Scoring Matrix Construction, in detail #3 • Last step: the log-odds matrix • log to base 10: a value of +1 would mean that the corresponding pair has been observed 10 times more frequently than expected by chance. The most commonly used matrix is the matrix from the 1978 edition of the Dayhoff atlas, at PAM 250: this is also frequently referred to as the MDM78 PAM250 matrix. • Fourth step: Mutation Probability Matrix • The probability that an amino acid in row i of the matrix will replace the amino acid in column j : the mutability of amino acid j, multiplied by the pair exchange frequency for ij divided by the sum of all pair exchange frequencies for amino acid i:
Different Matrices are Appropriate at Different Evolutionary Distances (Adapted from D Brutlag, Stanford)
PAM-250 (distant) Change in Matrix with Ev. Dist. PAM-78 (Adapted from D Brutlag, Stanford)
- Simplest way: the identity matrix - A very crude model : to use the genetic code matrix, the number of point mutations necessary to transform one codon into the other. Other similarity scoring matrices might be constructed from any property of amino acids that can be quantified -partition coefficients between hydrophobic and hydrophilic phases -charge -molecular volume, etc. Unfortunately, all these biophysical quantities suffer from the fact that they provide only a partial view of the picture - there is no guarantee, that any particular property is a good predictor for conservation of amino acids between related proteins. Other Matrices:How to score the exchange of two amino acids in an alignment? (graphic adapted from W Taylor)
Some concepts challenged: Are the evolutionary rates uniform over the whole of the protein sequence? (No.) The BLOSUM matrices: Henikoff & Henikoff (Henikoff, S. & Henikoff J.G. (1992) PNAS89:10915-10919) . -Use blocks of sequence fragments from different protein families which can be aligned without the introduction of gaps. Amino acid pair frequencies can be compiled from these blocks Different evolutionary distances are incorporated into this scheme with a clustering procedure: two sequences that are identical to each other for more than a certain threshold of positions are clustered. More sequences are added to the cluster if they are identical to any sequence already in the cluster at the same level. All sequences within a cluster are then simply averaged. (A consequence of this clustering is that the contribution of closely related sequences to the frequency table is reduced, if the identity requirement is reduced. ) This leads to a series of matrices, analogous to the PAM series of matrices. BLOSUM80: derived at the 80% identity level. The BLOSUM Matrices BLOSUM62 is the BLAST default
Local vs. Global Alignment • GLOBAL = best alignment of entirety of both sequences • For optimum global alignment, we want best score in the final row or final column • Are these sequences generally the same? • Needleman Wunsch • find alignment in which total score is highest, perhaps at expense of areas of great local similarity • LOCAL = best alignment of segments, without regard to rest of sequence • For optimum local alignment, we want best score anywhere in matrix (will discuss) • Do these two sequences contain high scoring subsequences • Smith Waterman • find alignment in which the highest scoring subsequences are identified, at the expense of the overall score (Adapted from R Altman)
Modifications for Local Alignment 1. The scoring system uses negative scores for mismatches 2. The minimum score for [i,j] is zero 3. The best score anywhere in the matrix (not just last column or row) • These three changes cause the algorithm to seek high scoring subsequences, which are not penalized for their global effects (mod. 1), which don’t include areas of poor match (mod. 2), and which can occur anywhere (mod. 3) (Adapted from R Altman)
Multiple Sequence Alignments - Practically useful methods only since 1987 - Before 1987 they were constructed by hand - The basic problem: no dynamic programming approach can be used - First useful approach by D. Sankoff (1987) based on phylogenetics - One of the most essential tools in molecular biology It is widely used in: - Phylogenetic analysis - Prediction of protein secondary/tertiary structure - Finding diagnostic patterns to characterize protein families - Detecting new homologies between new genes and established sequence families (LEFT, adapted from Sonhammer et al. (1997). “Pfam,” Proteins 28:405-20. ABOVE, G Barton AMAS web page)
Progressive Multiple Alignments - Most multiple alignments based on this approach - Initial guess for a phylogenetic tree based on pairwise alignments - Built progressively starting with most closely related sequences - Follows branching order in phylogenetic tree - Sufficiently fast - Sensitive - Algorithmically heuristic, no mathematical property associated with the alignment - Biologically sound, it is common to derive alignments which are impossible to improve by eye (adapted from Sonhammer et al. (1997). “Pfam,” Proteins 28:405-20)
Problems with Progressive Alignments - Local Minimum Problem - Parameter Choice Problem 1. Local Minimum Problem - It stems from greedy nature of alignment (mistakes made early in alignment cannot be corrected later) - A better tree gives a better alignment (UPGMA neighbour-joining tree method) 2. Parameter Choice Problem • - It stems from using just one set of parameters (and hoping that they will do for all)
Fuse multiple alignment into: • - Motif: a short signature pattern identified in the conserved region of the multiple alignment • - Profile: frequency of each amino acid at each position is estimated • HMM: Hidden Markov Model, a generalized profile in rigorous mathematical terms Profiles MotifsHMMs Can get more sensitive searches with these multiple alignment representations (Run the profile against the DB.)
Profiles Profile : a position-specific scoring matrix composed of 21 columns and N rows (N=length of sequences in multiple alignment)
Profiles formula for position M(p,a) M(p,a) = chance of finding amino acid a at position p Msimp(p,a) = number of times a occurs at p divided by number of sequences However, what if don’t have many sequences in alignment? Msimp(p,a) might be baised. Zeros for rare amino acids. Thus: Mcplx(p,a)= b=1 to 20Msimp(p,b) x Y(b,a) Y(b,a): Dayhoff matrix for a and b amino acids S(p,a) ~ a=1 to 20Msimp(p,a) ln Msimp(p,a)
Profiles formula for entropy H(p,a) H(p,a) = - a=1 to 20f(p,a) log2 f(p,a), where f(p,a) = frequency of amino acid a occurs at position p ( Msimp(p,a) ) Say column only has one aa (AAAAA): H(p,a) = 1 log2 1 + 0 log2 0 + 0 log2 0 + … = 0 + 0 + 0 + … = 0 Say column is random with all aa equiprobable (ACD..ACD..ACD..):Hrand(p,a) = .05 log2 .05 + .05 log2 .05 + … = -.22 + -.22 + … = -4.3 Say column is random with aa occurring according to probability found inthe sequence databases (ACAAAADAADDDDAAAA….):Hdb(a) = - a=1 to 20F(a) log2 F(a), where F(a) is freq. of occurrence of a in DB Hcorrected(p,a) = H(p,a) – Hdb(a)
Ca28_HumanELSAHATPAFTAVLTSPLPASGMPVKFDRTLYNGHSGYNPATGIFTCPVGGVYYFAYHVHVKGTNVWVALYKNNVPATYTYDEYKKGYLDQASGGAVLQLRPNDQVWVQIPSDQANGLYSTEYIHSSFSGFLLCPTC1qb_HumanDYKATQKIAFSATRTINVPLRRDQTIRFDHVITNMNNNYEPRSGKFTCKVPGLYYFTYHASSRGNLCVNLMRGRERAQKVVTFCDYAYNTFQVTTGGMVLKLEQGENVFLQATDKNSLLGMEGANSIFSGFLLFPDCerb_HumanVRSGSAKVAFSAIRSTNHEPSEMSNRTMIIYFDQVLVNIGNNFDSERSTFIAPRKGIYSFNFHVVKVYNRQTIQVSLMLNGWPVISAFAGDQDVTREAASNGVLIQMEKGDRAYLKLERGNLMGGWKYSTFSGFLVFPLCOLE_LEPMA.264RGPKGPPGESVEQIRSAFSVGLFPSRSFPPPSLPVKFDKVFYNGEGHWDPTLNKFNVTYPGVYLFSYHITVRNRPVRAALVVNGVRKLRTRDSLYGQDIDQASNLALLHLTDGDQVWLETLRDWNGXYSSSEDDSTFSGFLLYPDTKKPTAMHP27_TAMAS.72GPPGPPGMTVNCHSKGTSAFAVKANELPPAPSQPVIFKEALHDAQGHFDLATGVFTCPVPGLYQFGFHIEAVQRAVKVSLMRNGTQVMEREAEAQDGYEHISGTAILQLGMEDRVWLENKLSQTDLERGTVQAVFSGFLIHENHSUPST2_1.95GIQGRKGEPGEGAYVYRSAFSVGLETYVTIPNMPIRFTKIFYNQQNHYDGSTGKFHCNIPGLYYFAYHITVYMKDVKVSLFKKDKAMLFTYDQYQENNVDQASGSVLLHLEVGDQVWLQVYGEGERNGLYADNDNDSTFTGFLLYHDTN2.HS27109_1ENALAPDFSKGSYRYAPMVAFFASHTYGMTIPGPILFNNLDVNYGASYTPRTGKFRIPYLGVYVFKYTIESFSAHISGFLVVDGIDKLAFESENINSEIHCDRVLTGDALLELNYGQEVWLRLAKGTIPAKFPPVTTFSGYLLYRT4.YQCC_BACSUVVHGWTPWQKISGFAHANIGTTGVQYLKKIDHTKIAFNRVIKDSHNAFDTKNNRFIAPNDGMYLIGASIYTLNYTSYINFHLKVYLNGKAYKTLHHVRGDFQEKDNGMNLGLNGNATVPMNKGDYVEIWCYCNYGGDETLKRAVDDKNGVFNFFD5.BSPBSXSE_25ADSGWTAWQKISGFAHANIGTTGRQALIKGENNKIKYNRIIKDSHKLFDTKNNRFVASHAGMHLVSASLYIENTERYSNFELYVYVNGTKYKLMNQFRMPTPSNNSDNEFNATVTGSVTVPLDAGDYVEIYVYVGYSGDVTRYVTDSNGALNYFDCa28_HumanELSAHATPAFTAVLTSPLPASGMPVKFDRTLYNGHSGYNPATGIFTCPVGGVYYFAYHVHVKGTNVWVALYKNNVPATYTYDEYKKGYLDQASGGAVLQLRPNDQVWVQIPSDQANGLYSTEYIHSSFSGFLLCPTC1qb_HumanDYKATQKIAFSATRTINVPLRRDQTIRFDHVITNMNNNYEPRSGKFTCKVPGLYYFTYHASSRGNLCVNLMRGRERAQKVVTFCDYAYNTFQVTTGGMVLKLEQGENVFLQATDKNSLLGMEGANSIFSGFLLFPDCerb_HumanVRSGSAKVAFSAIRSTNHEPSEMSNRTMIIYFDQVLVNIGNNFDSERSTFIAPRKGIYSFNFHVVKVYNRQTIQVSLMLNGWPVISAFAGDQDVTREAASNGVLIQMEKGDRAYLKLERGNLMGGWKYSTFSGFLVFPLCOLE_LEPMA.264RGPKGPPGESVEQIRSAFSVGLFPSRSFPPPSLPVKFDKVFYNGEGHWDPTLNKFNVTYPGVYLFSYHITVRNRPVRAALVVNGVRKLRTRDSLYGQDIDQASNLALLHLTDGDQVWLETLRDWNGXYSSSEDDSTFSGFLLYPDTKKPTAMHP27_TAMAS.72GPPGPPGMTVNCHSKGTSAFAVKANELPPAPSQPVIFKEALHDAQGHFDLATGVFTCPVPGLYQFGFHIEAVQRAVKVSLMRNGTQVMEREAEAQDGYEHISGTAILQLGMEDRVWLENKLSQTDLERGTVQAVFSGFLIHENHSUPST2_1.95GIQGRKGEPGEGAYVYRSAFSVGLETYVTIPNMPIRFTKIFYNQQNHYDGSTGKFHCNIPGLYYFAYHITVYMKDVKVSLFKKDKAMLFTYDQYQENNVDQASGSVLLHLEVGDQVWLQVYGEGERNGLYADNDNDSTFTGFLLYHDTN2.HS27109_1ENALAPDFSKGSYRYAPMVAFFASHTYGMTIPGPILFNNLDVNYGASYTPRTGKFRIPYLGVYVFKYTIESFSAHISGFLVVDGIDKLAFESENINSEIHCDRVLTGDALLELNYGQEVWLRLAKGTIPAKFPPVTTFSGYLLYRT4.YQCC_BACSUVVHGWTPWQKISGFAHANIGTTGVQYLKKIDHTKIAFNRVIKDSHNAFDTKNNRFIAPNDGMYLIGASIYTLNYTSYINFHLKVYLNGKAYKTLHHVRGDFQEKDNGMNLGLNGNATVPMNKGDYVEIWCYCNYGGDETLKRAVDDKNGVFNFFD5.BSPBSXSE_25ADSGWTAWQKISGFAHANIGTTGRQALIKGENNKIKYNRIIKDSHKLFDTKNNRFVASHAGMHLVSASLYIENTERYSNFELYVYVNGTKYKLMNQFRMPTPSNNSDNEFNATVTGSVTVPLDAGDYVEIYVYVGYSGDVTRYVTDSNGALNYFD C1Q - Example
MMCOL10A1_1.483 SGMPLVSANHGVTG-------MPVSAFTVILS--KAYPA---VGCPHPIYEILYNRQQHYCa1x_Chick ----------ALTG-------MPVSAFTVILS--KAYPG---ATVPIKFDKILYNRQQHYS15435 ----------GGPA-------YEMPAFTAELT--APFPP---VGGPVKFNKLLYNGRQNYCA18_MOUSE.597 HAYAGKKGKHGGPA-------YEMPAFTAELT--VPFPP---VGAPVKFDKLLYNGRQNYCa28_Human ----------ELSA-------HATPAFTAVLT--SPLPA---SGMPVKFDRTLYNGHSGYMM37222_1.98 ----GTPGRKGEPGE---AAYMYRSAFSVGLETRVTVP-----NVPIRFTKIFYNQQNHYCOLE_LEPMA.264 ------RGPKGPPGE---SVEQIRSAFSVGLFPSRSFPP---PSLPVKFDKVFYNGEGHWHP27_TAMAS.72 -------GPPGPPGMTVNCHSKGTSAFAVKAN--ELPPA---PSQPVIFKEALHDAQGHFS19018 ----------NIRD-------QPRPAFSAIRQ---NPMT---LGNVVIFDKVLTNQESPYC1qb_Mouse --------------D---YRATQKVAFSALRTINSPLR----PNQVIRFEKVITNANENYC1qb_Human --------------D---YKATQKIAFSATRTINVPLR----RDQTIRFDHVITNMNNNYCerb_Human --------------V---RSGSAKVAFSAIRSTNHEPSEMSNRTMIIYFDQVLVNIGNNF2.HS27109_1 ---ENALAPDFSKGS---YRYAPMVAFFASHTYGMTIP------GPILFNNLDVNYGASY .* . : : MMCOL10A1_1.483 DPRSGIFTCKIPGIYYFSYHVHVKGT--HVWVGLYKNGTP-TMYTY---DEYSKGYLDTACa1x_Chick DPRTGIFTCRIPGLYYFSYHVHAKGT--NVWVALYKNGSP-VMYTY---DEYQKGYLDQAS15435 NPQTGIFTCEVPGVYYFAYHVHCKGG--NVWVALFKNNEP-VMYTY---DEYKKGFLDQACA18_MOUSE.597 NPQTGIFTCEVPGVYYFAYHVHCKGG--NVWVALFKNNEP-MMYTY---DEYKKGFLDQACa28_Human NPATGIFTCPVGGVYYFAYHVHVKGT--NVWVALYKNNVP-ATYTY---DEYKKGYLDQAMM37222_1.98 DGSTGKFYCNIPGLYYFSYHITVYMK--DVKVSLFKKDKA-VLFTY---DQYQEKNVDQACOLE_LEPMA.264 DPTLNKFNVTYPGVYLFSYHITVRNR--PVRAALVVNGVR-KLRTR---DSLYGQDIDQAHP27_TAMAS.72 DLATGVFTCPVPGLYQFGFHIEAVQR--AVKVSLMRNGTQ-VMERE---AEAQDG-YEHIS19018 QNHTGRFICAVPGFYYFNFQVISKWD--LCLFIKSSSGGQ-PRDSLSFSNTNNKGLFQVLC1qb_Mouse EPRNGKFTCKVPGLYYFTYHASSRGN---LCVNLVRGRDRDSMQKVVTFCDYAQNTFQVTC1qb_Human EPRSGKFTCKVPGLYYFTYHASSRGN---LCVNLMRGRER--AQKVVTFCDYAYNTFQVTCerb_Human DSERSTFIAPRKGIYSFNFHVVKVYNRQTIQVSLMLNGWP----VISAFAGDQDVTREAA2.HS27109_1 TPRTGKFRIPYLGVYVFKYTIESFSA--HISGFLVVDGIDKLAFESEN-INSEIHCDRVL . * * * * : MMCOL10A1_1.483 SGSAIMELTENDQVWLQLPNA-ESNGLYSSEYVHSSFSGFLVAPM-------Ca1x_Chick SGSAVIDLMENDQVWLQLPNS-ESNGLYSSEYVHSSFSGFLFAQI-------S15435 SGSAVLLLRPGDRVFLQMPSE-QAAGLYAGQYVHSSFSGYLLYPM-------CA18_MOUSE.597 SGSAVLLLRPGDQVFLQNPFE-QAAGLYAGQYVHSSFSGYLLYPM-------Ca28_Human SGGAVLQLRPNDQVWVQIPSD-QANGLYSTEYIHSSFSGFLLCPT-------MM37222_1.98 SGSVLLHLEVGDQVWLQVYGDGDHNGLYADNVNDSTFTGFLLYHDTN-----COLE_LEPMA.264 SNLALLHLTDGDQVWLETLR--DWNGXYSSSEDDSTFSGFLLYPDTKKPTAMHP27_TAMAS.72 SGTAILQLGMEDRVWLENKL--SQTDLERG-TVQAVFSGFLIHEN-------S19018 AGGTVLQLRRGDEVWIEKDP--AKGRIYQGTEADSIFSGFLIFPS-------C1qb_Mouse TGGVVLKLEQEEVVHLQATD---KNSLLGIEGANSIFTGFLLFPD-------C1qb_Human TGGMVLKLEQGENVFLQATD---KNSLLGMEGANSIFSGFLLFPD-------Cerb_Human SNGVLIQMEKGDRAYLKLER---GN-LMGG-WKYSTFSGFLVFPL-------2.HS27109_1 TGDALLELNYGQEVWLRLAK----GTIPAKFPPVTTFSGYLLYRT------- . :: : : . : * *:*. Clustal Alignment
- several proteins are grouped together by similarity searches - they share a conserved motif - motif is stringent enough to retrieve the family members from the complete protein database - PROSITE: a collection of motifs (1135 different motifs) Motifs
Prosite Pattern -- EGF like pattern • A sequence of about thirty to forty amino-acid residues long found in the sequence of epidermal growth factor (EGF) has been shown [1 to 6] to be present, in a more or less conserved form, in a large number of other, mostly animal proteins. The proteins currently known to contain one or more copies of an EGF-like pattern are listed below. - Bone morphogenic protein 1 (BMP-1), a protein which induces cartilage and bone formation. - Caenorhabditis elegans developmental proteins lin-12 (13 copies) and glp-1 (10 copies). - Calcium-dependent serine proteinase (CASP) which degrades the extracellular matrix proteins type …. - Cell surface antigen 114/A10 (3 copies). - Cell surface glycoprotein complex transmembrane subunit . - Coagulation associated proteins C, Z (2 copies) and S (4 copies). - Coagulation factors VII, IX, X and XII (2 copies). - Complement C1r/C1s components (1 copy). - Complement-activating component of Ra-reactive factor (RARF) (1 copy). - Complement components C6, C7, C8 alpha and beta chains, and C9 (1 copy). - Epidermal growth factor precursor (7-9 copies). • +-------------------+ +-------------------------+ | | | |x(4)-C-x(0,48)-C-x(3,12)-C-x(1,70)-C-x(1,6)-C-x(2)-G-a-x(0,21)-G-x(2)-C-x | | ************************************ +-------------------+ • 'C': conserved cysteine involved in a disulfide bond.'G': often conserved glycine'a': often conserved aromatic amino acid'*': position of both patterns.'x': any residue-Consensus pattern: C-x-C-x(5)-G-x(2)-C [The 3 C's are involved in disulfide bonds] • http://www.expasy.ch/sprot/prosite.html
EGF Profile Generated for SEARCHWISE Cons A C D E F G H I K L M N P Q R S T V W Y Gap V -1 -2 -9 -5 -13 -18 -2 -5 -2 -7 -4 -3 -5 -1 -3 0 0 -1 -24 -10 100 D 0 -14 -1 -1 -16 -10 0 -12 0 -13 -8 1 -3 0 -2 0 0 -8 -26 -9 100 V 0 -13 -9 -7 -15 -10 -6 -5 -5 -7 -5 -6 -4 -4 -6 -1 0 -1 -27 -14 100 D 0 -20 18 11 -34 0 4 -26 7 -27 -20 15 0 7 4 6 2 -19 -38 -21 100 P 3 -18 1 3 -26 -9 -5 -14 -1 -14 -12 -1 12 1 -4 2 0 -9 -37 -22 100 C 5 115 -32 -30 -8 -20 -13 -11 -28 -15 -9 -18 -31 -24 -22 1 -5 0 -10 -5 100 A 2 -7 -2 -2 -21 -5 -4 -12 -2 -13 -9 0 -1 0 -3 2 1 -7 -30 -17 100 s 2 -12 3 2 -25 0 0 -18 0 -18 -13 4 3 1 -1 7 4 -12 -30 -16 25 n -1 -15 4 4 -19 -7 3 -16 2 -16 -10 7 -6 3 0 2 0 -11 -23 -10 25 p 0 -18 -7 -6 -17 -11 0 -17 -5 -15 -14 -5 28 -2 -5 0 -1 -13 -26 -9 25 c 5 115 -32 -30 -8 -20 -13 -11 -28 -15 -9 -18 -31 -24 -22 1 -5 0 -10 -5 25 L -5 -14 -17 -9 0 -25 -5 4 -5 8 8 -12 -14 -1 -5 -7 -5 2 -15 -5 100 N -4 -16 12 5 -20 0 24 -24 5 -25 -18 25 -10 6 2 4 1 -19 -26 -2 100 g 1 -16 7 1 -35 29 0 -31 -1 -31 -23 12 -10 0 -1 4 -3 -23 -32 -23 50 G 6 -17 0 -7 -49 59 -13 -41 -10 -41 -32 3 -14 -9 -9 5 -9 -29 -39 -38 100 T 3 -10 0 2 -21 -12 -3 -5 1 -11 -5 1 -4 1 -1 6 11 0 -33 -18 100 C 5 115 -32 -30 -8 -20 -13 -11 -28 -15 -9 -18 -31 -24 -22 1 -5 0 -10 -5 100 I -6 -13 -19 -11 0 -28 -5 8 -4 6 8 -12 -17 -4 -5 -9 -4 6 -12 -1 100 d -4 -19 8 6 -15 -13 5 -17 0 -16 -12 5 -9 2 -2 -1 -1 -13 -24 -5 31 i 0 -6 -8 -6 -4 -11 -5 3 -5 1 2 -5 -8 -4 -6 -2 0 4 -14 -6 31 g 1 -13 0 0 -20 -3 -3 -12 -3 -13 -8 0 -7 0 -5 2 0 -7 -29 -16 31 L -5 -11 -20 -14 0 -23 -9 9 -11 8 7 -14 -17 -9 -14 -8 -4 7 -17 -5 100 E 0 -20 14 10 -33 5 0 -25 2 -26 -19 11 -9 4 0 3 0 -19 -34 -22 100 S 3 -13 4 3 -28 3 0 -18 2 -20 -13 6 -6 3 1 6 3 -12 -32 -20 100 Y -14 -9 -25 -22 31 -34 10 -5 -17 0 -1 -14 -13 -13 -15 -14 -13 -7 17 44 100 T 0 -10 -6 -1 -11 -16 -2 -7 -1 -9 -5 -3 -9 0 -1 1 3 -4 -16 -8 100C 5 115 -32 -30 -8 -20 -13 -11 -28 -15 -9 -18 -31 -24 -22 1 -5 0 -10 -5 100 R 0 -13 0 2 -19 -11 1 -12 4 -13 -8 3 -8 4 5 1 1 -8 -23 -13 100 C 5 115 -32 -30 -8 -20 -13 -11 -28 -15 -9 -18 -31 -24 -22 1 -5 0 -10 -5 100 P 0 -14 -8 -4 -15 -17 0 -7 -1 -7 -5 -4 6 0 -2 0 1 -3 -26 -10 100 P 1 -18 -3 0 -24 -13 -3 -12 1 -13 -10 -2 15 2 0 2 1 -8 -33 -19 100 G 4 -19 3 -4 -48 53 -11 -40 -7 -40 -31 5 -13 -7 -7 4 -7 -29 -39 -36 100 y -22 -6 -35 -31 55 -43 11 -1 -25 6 4 -21 -34 -20 -21 -22 -20 -7 43 63 50 S 1 -9 -3 -1 -14 -7 0 -10 -2 -12 -7 0 -7 0 -4 4 4 -5 -24 -9 100 G 5 -20 1 -8 -52 66 -14 -45 -11 -44 -35 4 -16 -10 -10 4 -11 -33 -40 -40 100 E 2 -20 10 12 -31 -7 0 -19 6 -20 -15 5 4 7 2 4 2 -13 -38 -22 100 R -5 -17 0 1 -16 -13 8 -16 9 -16 -11 5 -11 7 15 -1 -1 -13 -18 -6 100 C 5 115 -32 -30 -8 -20 -13 -11 -28 -15 -9 -18 -31 -24 -22 1 -5 0 -10 -5 100 E 0 -26 20 25 -34 -5 6 -25 10 -25 -17 9 -4 16 5 3 0 -18 -38 -23 100 T -4 -11 -13 -8 -1 -21 2 0 -4 -1 0 -6 -14 -3 -5 -4 0 0 -15 0 100 D 0 -18 5 4 -24 -11 -1 -11 2 -14 -9 1 -6 2 0 0 0 -6 -34 -18 100 I 0 -10 -2 -1 -17 -14 -3 -4 -1 -9 -4 0 -11 0 -4 0 2 -1 -29 -14 100 D -4 -15 -1 -2 -13 -16 -3 -8 -5 -6 -4 -1 -7 -2 -7 -3 -2 -6 -27 -12 100 Cons. Cys
Hidden Markov Model: - a composition of finite number of states, - each corresponding to a column in a multiple alignment - each state emits symbols, according to symbol-emission probabilities Starting from an initial state, a sequence of symbols is generated by moving from state to state until an end state is reached. HMMs (Figures from Eddy, Curr. Opin. Struct. Biol.)
Markov Models D 0.2 C 0.5 E 0.3 0.4 A 0.5 MM 0.1 B 0.8 Path: A D B C Probability = Init(A)*0.5*0.3*0.4
Hidden Markov models The path is unknown (hidden): H H T H T T H T T T Probability = ? 0.1 H: 0.5 H: 0.3 HMM T: 0.5 T: 0.7 0.6