Download
1 / 15
150 likes | 273 Vues
This document provides a comprehensive overview of the FY 2013 budget preparation process, focusing on revenue forecasts and strategic reallocations within the district. It analyzes various scenarios, including worst, better, and best cases, while emphasizing the need for efficiency amidst financial constraints. Detailed insights are presented on leadership team reductions, compensation reforms, and a strategic plan alignment with educational goals. The aim is to illustrate how careful budgeting and resource management can drive improvements in education with limited funds.

E N D
Fiscally PREPARED FY 2013Reducing and Reallocating
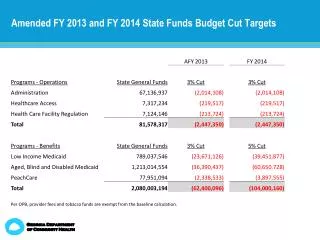
How Did We Get Here? • September State Revenue Forecast / Governor's Budget Proposal (Nov, 1, 2012) • Worst case scenario • No cuts, no increase • Better case • Increase in funding • Best case • Increase in SBB • Increase in compensation
How Did We Get Here? • Cost of Business Savings in 2011/12 • Budget Items adjusted • Funded 1% one time stipend • Funded one time SBB increases • Reallocated dollars (1% ongoing raise) • Projected costs adjusted for next year • $2.2 M PERA • Health insurance increases • Fuel costs
How Did We Get Here? • Central Office (12 M) • Doing more with less • Prioritizing work with Strategic Plan • HS Schedule (3.5 M, portion back one time) • MS (.5 M, replaced one time) • Contract Negotiations (2 M)
Central Leadership Team FTE2008 - 2013 Over 10 FTE decrease (18%) since 2010 20 FTE decrease (30%) since 2008
Central Leadership Team Compensation2008 - 2013 * *Includes district-wide 3% increase
Senior Cabinet Savings(Part of the Leadership Team Savings) Since 2010, saved over $100,000 yearly
Some Examples of Central Leadership Reductions / Reallocations
DCSD Support Services In 2010, In 2013
Central Leadership Team Compensation Dollars 2.8 M Cumulative savings since 2010 Over $750,000 savings in 2013 over 2010 inclusive of the 1% salary increase and the 2% retention stipend Leadership Team Reorganization savings in the first year: Over $900,000 2011 over 2010 and decreased again in 2012
PK-12 Education 2009 - 2013 10 to 7 Asst. Supt / Exec. Dir. / Directors Reorganization of K-12 Education to PK-12 incorporating Early Childhood, SPED, Health Services, Student Leadership 2 to 1 Early Childhood Coordinators 2 to 1 Special Education Directors
Focusing on the Identified Priorities of the Strategic Plan
Focusing On Instruction • Curriculum • Development and implementation of GVC – District Wide Curriculum did not exist • Driving good instruction through identified world class education targets • Assessment • Development and implementation of BAS • Core Area Interim Assessments Developed • Ready for SB-191 implementation • Aligned / Targeted Professional Development
Support Services Successes 2011 - 2013 Wide Area Network & Personal Device Initiative Special Education MOE & Charter Purchased Services Capital Asset policies and procedures Increased Business Process Efficiencies & clarity Partnering with Charters providing classroom spaces – COP policy and implementation
Human Resources 2011-2013 Reforming DCSD Compensation Practices Eliminated the practice of paying the Senior Cabinet employee’s portion of PERA Implementing Market Based Pay for Certified Employees Reforming Pay for Performance – Pay for teaching DCSD students not for years of service and taking classes Implementing Short Term Disability Insurance Reforming pay practices associated with responsibility pay