Download
1 / 8
80 likes | 178 Vues
At Brown University, this study aims to validate blood flow simulations in intracranial aneurysms by comparing concentration fields in patient-specific geometries with MRI images post dye injection. Data on arterial geometry reconstruction, mesh generation, and concentration fields from velocity fields are analyzed and compared with CT and computational results. The study concludes that the simulated concentration field aligns with angiograms from dye injections, setting the groundwork for future quantitative comparisons with 2D-3D image registration techniques.

E N D
Yue Yu Validation of Blood Flow Simulations in Intracranial Aneurysms Mid-Project Presentation Brown University
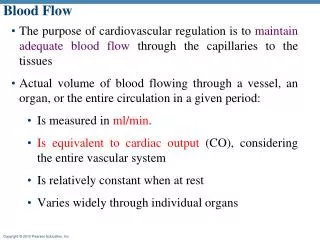
By comparing the concentration field in patient specific geometry and the MRI images from dye injection, we aim to validates our spectral element simulations for blood flow. Objective
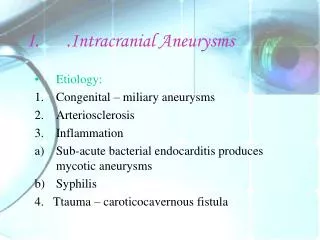
Data for Reconstructing Arterial Geometry 1.With contrast 2.Without contrast 3.Subtract 1 from 2 Slice set 28 Slice set 128 *This set of data are static CT images taken from 173 different angles, and they will be used for structural reconstruction
Segmentation • Get signal density information for every voxels by interpolation. • Setting appropriate threshold for each 2D slice manually (because the sizes of arteries vary a lot, the threshold might vary slice by slice), then reconstruct the 3D arterial geometry by interpolating between these slices.
Mesh generation • Meshes are generated in GRIDGEN, 1d->2d->3d.
Concentration field from velocity fields • Given the velocity fields u (solved beforehand from Navier Stokes equation in the given geometry), solve the relative concentration field c • with the Peclet number Pe=UL/D. Pe=Re, t=0.2Cardiac Cycle Pe=Re/10, t=0.2Cardiac Cycle The actual Peclet number is about Pe=10000Re. But with that we have to use very small time steps to keep the stability.
CT results: Dye injection validation: with CT images Computational results: T=0.22 (sec) T=0.72 (sec) T=0.22 (sec) T=0.72 (sec) T=1.22 (sec) T=1.72 (sec) T=1.22 (sec) T=1.72 (sec)
Conclusion: The concentration field calculated from simulated velocity field looks similar with the angiograms from dye injection. Conclusions and future work Next step: Quantitatively compare the computational results and the angiograms with 2D-3D image registration technique.