Download
1 / 38
380 likes | 395 Vues
Explore the data needs and integration issues in achieving the Millennium Development Goals and Sustainable Development through geospatial analysis.

E N D
Workshop on Geospatial Analysis for Attaining the Millennium Development Goals and Sustainable Development Bonn, Center for Remote Sensing of Land Surfaces (ZFL) of the University of Bonn, April 20-24 2009 Day 3Census, Surveys and GPS data
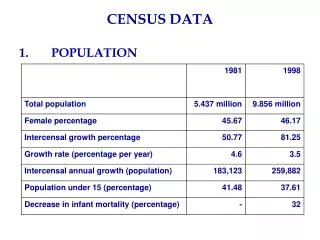
A Glimpse at the Data Needs • Monitoring MGD and Sustainable Development • Goals, targets and indicators • OfficialList2008_mdgindicators.dochttp://unstats.un.org/unsd/mdg/Host.aspx?Content=Indicators/OfficialList.htm • What is needed? • Socioeconomic data. • Physical environment data. • Geo-referenced data. • Sub-national data, at least level 1 (country = level 0).
Goal 1: Eradicate extreme poverty and hunger • Target 1.A: Halve, between 1990 and 2015, the proportion of people whose income is less than one dollar a day • Proportion of population below $1 (PPP, purchasing power parity) per day (For monitoring country poverty trends, indicators based on national poverty lines should be used, where available) • Poverty gap ratio • Share of poorest quintile in national consumption • Target 1.B: Achieve full and productive employment and decent work for all, including women and young people • Growth rate of GDP per person employed • Employment-to-population ratio • Proportion of employed people living below $1 (PPP) per day • Proportion of own-account and contributing family workers in total employment • Target 1.C: Halve, between 1990 and 2015, the proportion of people who suffer from hunger • Prevalence of underweight children under-five years of age • Proportion of population below minimum level of dietary energy consumption
Goal 7: Ensure environmental sustainability • Target 7.A: Integrate the principles of sustainable development into country policies and programmes and reverse the loss of environmental resources; and Target 7.B: Reduce biodiversity loss, achieving, by 2010, a significant reduction in the rate of loss • Proportion of land area covered by forest • CO2 emissions, total, per capita and per $1 GDP (PPP) • Consumption of ozone-depleting substances • Proportion of fish stocks within safe biological limits • Proportion of total water resources used • Proportion of terrestrial and marine areas protected • Proportion of species threatened with extinction • Target 7.C: Halve, by 2015, the proportion of people without sustainable access to safe drinking water and basic sanitation • Proportion of population using an improved drinking water source • Proportion of population using an improved sanitation facility • Target 7.D: By 2020, to have achieved a significant improvement in the lives of at least 100 million slum dwellers • Proportion of urban population living in slums (the actual proportion of people living in slums is measured by a proxy, represented by the urban population living in households with at least one of the four characteristics: (a) lack of access to improved water supply; (b) lack of access to improved sanitation; (c) overcrowding (3 or more persons per room); and (d) dwellings made of non-durable material))
Classical Data Integration Issues • Scientific disciplines use different types of data and units of analysis. • Biophysical features are typically measured in units not compatible with population surveys or censuses. • Population data is frequently stored in tabular format. • Physio-geographic variables (climate, vegetation, soils) are frequently stored in raster format. • Linking such data would require conversion to a common framework. • In particular, the systematic integration of population, social and biophysical (including climate) data would require a SPATIAL FRAMEWORK.
Data Sources : Inputs or the ‘building blocks’ Survey data: Other attributes Spatial data: Administrative boundary files, GPS data Census data: Population (Age Structure Other attributes) Raster, remotely sensed: vegetation, lights, built-up area
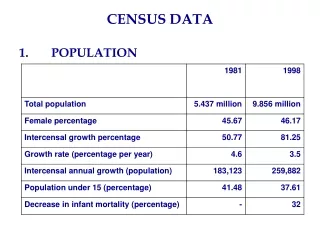
1. Census Data
Mixed Pros and Cons • Coverage • Geographic: very detailed, results can be representative for small geographic areas. • Temporal: decennial, long inter-census intervals. • Thematic: limited number of questions. • Provide DENOMINATORS even for small geographic areas. • Comparability across countries. • Availability of data beyond second administrative level could be difficult. • Costly to implement.
Gridded Population of the World - GPW • Two basic inputs: • Non-spatial population estimates, i.e. tables of population counts listed by administrative area names • Spatially explicit administrative boundary area • Steps: • Match population and administrative boundaries in vector (polygon) format should be geospatially consistent, and sum up to the national population (consistency checks) • The administrative data in polygon format is converted to raster grids • Medium resolution product, pixel size is ~5km (2.5 arc-minute) • Population counts and density • Released in 2005 • Data download at http://sedac.ciesin.columbia.edu/gpw/global.jsp
Some issues of census data • National census units may not be well delineated in geographic space, making it difficult to locate human populations. • Particularly relevant in relation to environmental and other hazards, and disaster mitigation. • Population mobility • Inter-annual change in the spatial distribution of population is difficult to characterize with precision because of incommensurate administrative boundaries across censuses. • Intra-annual variation in population distribution is not systematically tracked. • Changes in census spatial units are more common at higher resolution (census tract level and higher), which are the ones needed for vulnerability and other assessments.
1992 Ñuflo de Flores, Santa Cruz, Bolivia 2001 2002
Dealing with changes in administrative boundaries Changes due to subdivision of census enumeration units, but also to administrative changes Source: MaríaMuñíz, CIESIN, 2008
2. Survey Data
PROS Relatively lower costs Can cover larger number or more focused set of issues Flexibility – can focus the survey questions specific a particular research interest – HIV/AIDS, beliefs etc. Generalizable – with good survey design, can get data from sample and apply information to the larger population. Can be implemented more often and cheaper than full census. CONS Representative only for larger geographic areas (depend on the design) Dependent on response rate May have inherent bias due to self selection Comparability – different sets of questions may or may not be comparable between study areas. Translation to different languages may lead to different meanings Again, a mix of Pros and Cons
Global Poverty Mapping Project • Objectives: • to enhance current understanding of the global distribution of poverty and the geographic and biophysical conditions of where the poor live. • to assist policy makers, development agencies, and the poor themselves in designing interventions to reduce poverty. • Where the poor are? http://sedac.ciesin.columbia.edu/povmap/atlasMedia.jsp • World Bank initiated projects (More than a pretty picturehttp://siteresources.worldbank.org/INTPGI/Resources/342674-1092157888460/493860-1192739384563/More_Than_a_Pretty_Picture_ebook.pdf) • Two products: http://sedac.ciesin.columbia.edu/povmap/
A. Global Scale • Global data sets of poverty based on estimates of subnational infant mortality and child malnutrition data, as proxies for poverty and welfare rather than direct measures. • Data from Demographic and Health Surveys (DHS), Multiple Indicator Cluster Surveys (MICS), national Human Development Reports (HDRs), and other sources. • These data were first linked to boundary data for their reporting regions and then translated to a common grid. • IMR detects poverty differentials more at the low-end of the well-being indicator range • Data are typically not expressed at high-resolution for most countries (no urban) • Represents a single dimension of poverty • IMR is single-most available subnational indicator of well-being • Available for almost all countries at the first-administrative subdivision • Scalable indicator, that is, can adjust to a common year
A: (Global extent subnational data) Infant Mortality Rates, c. 2000 Subnational estimates of IMR based on DHS & MICS data for most developing countries
Millenium Villages Sites Selection Obtained percent of children underweight* from DHS and MICS surveys Survey sources: DHS, MICS, ANDI Match survey to boundary data Sub-national units created at finest resolution for which data are statistically robust 350+ sub-national units (SNUs) Children are defined as underweight if their weight-for-age z-scores are below minus two standard deviations (-2 SD) from the median of the NCHS/CDC/WHO International Reference Population hunger_hotspots_steps.doc
Final Step Selection of “hotspots”: Defined by the Hunger TF as those sub-national units with rates of childhood malnutrition >20% and more than 100,000 children who are underweight 75 sub-national units met this criteria See http://www.millenniumvillages.org/
B. Country Level Indirect Estimation Techniques: Small Area Estimates Poverty & Inequality Data Set: Different methodologies involving econometric or quantitative indirect estimation procedures combining spatial precision (such as censuses) with substantive depth (such as surveys). Poverty and Food Security Country Case Studies Direct Estimation Techniques: Unsatisfied Basic Needs Data Set: combining census level household measures such as access to adequate housing conditions, water, electricity, sanitation, and education, into a composite indicator of wellbeing for small administrative areas and linking these to geographic boundaries. • Many aspects of well-being • Consumption • Poverty • Inequality • High degree of subnational disaggregation (including urban) • Though method of indirect estimation is standard, bundle of goods, choice of poverty lines, and model specification vary. • About 40 countries have generated SAE (~ 20 avail).
Small Area Estimates “The term small area and local area are commonly used to denote a small geographical area, such as a county, a municipality or a census division. They may also describe a “small domain”, i.e. a small subpopulation such as a specific age-sex-race group of people within a large geographical area” (Ghosh and Rao 1994:55)
Small Area Estimates (2) • For poverty mapping: imputing into population census—which does not have consumption data—a measure of per capita consumption, or other variables, from household survey data, or other data • Relies on statistical relationships between common variables in census and survey data • Three Stages: • zero stage: establish comparability of data sources; identify common variables; understand sampling strategy. • First stage: estimate model of consumption in the household survey based on common variables. • second stage: take parameter estimates to census, predict consumption. Use this to estimate aggregate poverty and inequality indicators for small areas.
B: National-extent subnational data: Consumption, South Africa c.1996 Average Monthly Household Consumption for Third Administrative Sub-Division
3. Global Positioning System (GPS) Data
Overview • DHS (Demographic and Health Survey) collects data on latitude and longitude of surveyed clusters. • Objective: TO ANALYZE THE IMPACT OF LOCATION • Advantage: • to link DHS data with routine health data, health facilities locations, roads, rivers, other local infrastructure, environmental conditions • provide a set of point locations that can be linked to all of the household and individual level attributes contained in the full DHS dataset. • Locations for health facilities can be linked to the inventory and information on health workers. • Rather than constraining a geographic analysis to national or provincial levels, point data for the sample clusters can be aggregated to new units of analysis, such as climatic zones or ethnic regions. • New variables can also be attributed to the point locations and used in multivariate analysis.
DHS GPS Data (2) • Policy relevance: help planners to identify high-risk populations and target interventions more effectively. • DHS methodology adopted by the Living Standards and Measurement (World Bank) and the World Health Surveys (WHO), to be adopted by the Multiple Indicator Cluster Surveys (UNICEF) • Disadvantages: • Technical issues: • the accuracy of the GPS receiver’s calculated position depends on the strength and number of signals that it receives. Obstacles such as buildings, mountains, and tree canopies can distort the signals and introduce error to the reading. • User mistakes such as inaccurate or incomplete waypoint identification can be extremely difficult to rectify after the teams and GPS units have returned from the field. • Confidentiality issues http://sedac.ciesin.columbia.edu/confidentiality/
Confidentiality and location Source: Gutmann, M. and P. Stern, eds. 2007. Putting People on the Map: Protecting Confidentiality with Linked Social-Spatial Data. Washington, The National Academies Press. http://books.nap.edu/catalog.php?record_id=11865
Research question, generally asked in a non-spatial context: What are the determinants of infant and child mortality in West Africa? Proximate determinants—duration of the birth interval, maternal age, birth order, gender—play key roles Socioeconomic factors Education, particularly maternal education, well established factor Access to health services Geographic Urban-rural differences Distance-based measure usually beyond the scope of the data Macro-environmental factors rarely incorporated Example: Using GPS data to study infant mortality correlates
Objectives • To account for some of the variance in mortality that has not been captured by socioeconomic and proximate determinants • Particularly, variance in environmental or spatially-determined factors • To determine the relative importance of these factors vis-à-vis “traditional” ones, and to identify pathways of influence between and interactions among these various factors • Challenges: overcoming the “omitted variable” problem requires • Measurement • Ability to integrate data at the appropriate level of analysis
Primary Data • Demographic Health Surveys (DHS): Ten surveys undertaken 1997-2001, in countries where the DHS also had recorded the latitude-longitude location of the sampling cluster (EA) • GPS devices used to collect presumed centroid location of the EA at time of survey • The GPS-cluster locations allowed for integration of spatial information—distance to nearest city, aridity zone—with survey data for a fuller set of DHS variables
10 West African countries Benin Burkina Faso Cameroon Cote d’Ivoire Ghana Guinea Mali Niger Senegal Togo
Data integration for DHS • DHS-based characteristics of births, mothers, household wealth • Spatial and environmental variables: Climate (aridity, rainfall), Agriculture (farming system, length of growing season), Vector suitability (Malaria), Urban (distance to nearest city of varying sizes), Population Density, Access to markets (distance to coast) • The GPS-point locations of the sampling clusters were integrated with points, polygons, lines, and grid data by association with the nearest applicable feature, or averaging over features within a given distance, producing an integrated data set.