Stage 5: The test statistic!
140 likes | 287 Vues
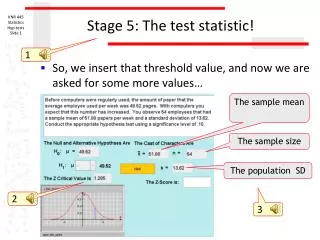
Stage 5: The test statistic!. 1. So, we insert that threshold value, and now we are asked for some more values…. The sample mean. The sample size. The population SD. 2. 3. Stage 5: The test statistic!.

Stage 5: The test statistic!
E N D
Presentation Transcript
Stage 5: The test statistic! 1 • So, we insert that threshold value, and now we are asked for some more values… The sample mean The sample size The population SD 2 3
Stage 5: The test statistic! • Why do we need these three? Because now we have to convert our difference score to a score on the distribution of sample means • Remember this? The purpose of this statistic was to convert a raw scoredifference (from the mean) by scaling it according to the spread of raw scores in the distribution of raw scores 1
Population mean Sample mean Variability of sample means Stage 5: The test statistic! The purpose of this statistic is the same, but it converts a sample meandifference (from µ) by scaling it according to the spread of all sample means in the distribution of sample means 1 2 3
Stage 5: The test statistic! • Understanding influences on the distribution of sample means…we’ll use the applet again 1 Note sample size… & note spread of sample means
Stage 5: The test statistic! • Understanding influences on the distribution of sample means…we’ll use the applet again 1 As sample size goes up… Spread of sample means goes down
Stage 5: The test statistic! • Understanding influences on the distribution of sample means… • That means that the test statistic has to take sample size into account • Other influences are mean difference (sample – population) and variability in the population • How do you think each of these things influence the test statistic? • This will help you understand why the test statistic looks like it does 1 2 3 4
Population mean Sample mean Variability of sample means Stage 5: The test statistic! A closer look: to understand how the mean difference, population variance, and sample size affect the test statistic, we need to look at the SEM in more detail 1
Stage 5: The test statistic! 1 Population standard deviation So…can you see the influences? 2 3 4 Sample size
Stage 5: The test statistic! • To calculate, then… • First the standard error of the mean: • Now the test statistic itself: 1
Stage 5: The test statistic! • For you to practice, I’ve provided a simple excel file that does the calculation bit for you… 1
Stage 6: The comparison & decision • Do we fail to reject the null? Or reject the null? 1
3 ways of phrasing the decision… • What is the probability of obtaining a Zobs = 1.273 if the difference is attributable only to random sampling error? • Is the observed probability (p) less than or equal to the -level set? • Is p ? 1
Reporting the Results • The observed mean of our treatment group was 51.88 ( 13.62) pages per employee per week. The z-test for one sample indicates that the difference between the observed mean of 51.88 and the population average of 49.52 was not statistically significant (Zobs = 1.27, p> 0.1). Our sample of employees did not use significantly more paper than the norm. 1
Do not reject H0 vs. Accept H0 • Accept infers that we are sure Ho is valid • Do not reject implies that this time we are unable to say with a high enough degree of confidence that the difference observed is attributable to anything other than sampling error. 2 1