
Analyzing Reaction Rates: A Step-by-Step Guide to Slope Calculation and Graph Generation
This guide details the process of analyzing reaction rates using data entry and graphical representation. Start by inputting your experimental data into the Chart Wizard to generate initial graphs. Choose two data points from the 0.5mM line, record their x and y values, and calculate the slope using the formula (Y2 - Y1) / (X2 - X1). Repeat this for subsequent substrate concentrations, entering all slopes into a table. Highlight the data and create an XY scatter graph. Discover insights about how substrate concentration influences reaction rates, noting any unexpected trends.

Analyzing Reaction Rates: A Step-by-Step Guide to Slope Calculation and Graph Generation
E N D
Presentation Transcript
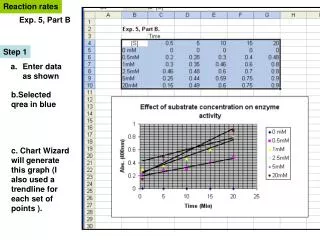
Reaction rates Exp. 5, Part B Step 1 • Enter data as shown b.Selected qrea in blue c. Chart Wizard will generate this graph (I also used a trendline for each set of points ).
Step 2 a. Pick two points on the 0.5mM line b. Record the x and y values for each point Y2, X2 Here, X2= 15 min X1= 5 min Y2= 0.4 units Y1= 0.23 units Y1, X1 I chose these two points c. Calculate slope of line = (Y2 – Y1)/ X2 –X1) =(0.4-0.23)/ 15-5) =0.17/10min or 0.017units/min d. Now do the same to calculate the slope for every other line.
Step 3 a. Enter slope of each line on a table In Chart Wizard, highlight blue area and select XY scatter and this style to make a graph. Note that the rate for 2.5 mM substrate is unexpected . Even so, conclusions can be made about the overall effect of substrate concentration on reaction rates.