Download
1 / 17
170 likes | 182 Vues
This research explores the cost reductions in wind power through experience curve analysis, providing a positive outlook for the future of wind energy. The study investigates the factors affecting wind power costs and proposes a model to reduce variability in cost forecasts. The findings suggest that wind power has the potential to become cheaper than coal or gas in the future.

E N D
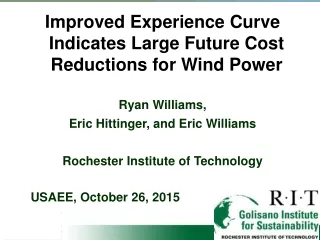
Improved Experience Curve Indicates Large Future Cost Reductions for Wind Power Ryan Williams, Eric Hittinger, and Eric Williams Rochester Institute of Technology USAEE, October 26, 2015
Forecasting cost of evolving energy technologies • Expectations of cost reductions important for policy, e.g. temporary vs. ongoing subsidy • Cost forecasts embedded in many energy system models, e.g. National Energy Modeling System (NEMS). • What is “best practice” cost forecast? • Approaches: Retrospective (e.g. experience curve), Expert elicitation, Bottom-up engineering/cost model
Experience Curve First ref.: Wright (1936) C(P) = C0 (P/P0)-α C = cost of production per energy unit P= cumulative production Learning rate (LR) : fraction cost down every doubling of production LR= 1-2-α For PV modules, LR=20%
Commentary on experience curve Pros: • Simple – one free parameter: learning rate • Surprisingly robust empirically given simplicity, e.g. Nagy et al (2013) showed that R-squared exceeds 90% for a majority of 62 investigated technologies. Cons: • Phenomenological – Why does it work? • How causal? If yes, “buy-down” is the key to cost reductions. Great if true, but…
Expectations for cost reductions in wind power Generally “pessimistic” outlook in policy relevant models: • U.S. Annual Energy Outlook assumes wind costs fall at a rate of 1% annually, same as coal generation • DOE 2015 Wind Vision report uses equivalent learning rate = 5.7% What do experience curves say about wind?
Prior experience curve results for wind power • 120 results from different studies, various countries and time intervals (Rubin et al 2015). • As yet, no explanation of variability.
Hypotheses • Experience curve is wrong model to describe historical costs of wind power. Need new model.
Hypotheses • Experience curve is wrong model to describe historical costs of wind power. Need new model. • If variability could be understood, model could be modified to address.
Goal: explain variability and develop a better model The plan: • Explore different versions of experience curve for wind power costs in the U.S. • Try to understand sources of variability in learning rates. • Find model that reduces variability • Note: U.S. wind growth roughly tracks global, so OK on international aspects of experience curve.
The factors to account for • Energy Cost ($/kWh) vs. Power Capacity Cost ($/kW) : Generation = Power Capacity x Capacity Factor • Wind Quality Adjusted Energy : • Annual wind variability • Lower site quality over time. • Exogenous fluctuations in capital cost: capital costs some years 2002-2010, partly due to weak US$ and high material costs
Regression results for wind: 1989-2013 A. Power Capacity B. Energy LR: 11% R2: 0.607 LR: 14.9% R2: 0.905 D. Full Model C. Wind Quality Adjusted Energy LR: 15.9% R2: 0.939 LR: 16.3% R2: 0.940
Understanding variability • Better R-squared does not fix the problem of variability in results • If variability can be understood, model form that reduces it is preferred. • Hypothesis: different starting and ending years of data-set is major driver of variability
Variability by dataset end year Model modifications much less sensitive to start and end year. Full model: LR = 10-21%, baseline 16%
Forecasting wind costs Full model forecasts wind cheaper than coal or gas.
Conclusions • Retrospective forecasting suggests very positive outlook for wind (~3 cents/kWh in 2030) • Best practice ~ critical view of engineering, expert and experience curve perspectives. • Implications of cheap wind important enough to justify effort.
exwgis@rit.edu Thank you for your attention! This research was supported by the National Science Foundation Letchworth State Park, near Rochester, New York