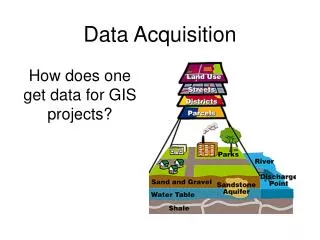

ALICE Data Acquisition
E N D
Presentation Transcript
ALICE Data Acquisition Ben Shepherd MaRS Group ASTeC STFC Daresbury Laboratory
Overview • Image Acquisition • Windows console tools • Machine Status • Excel DAQ • LabVIEW • Mathematica • ELOG
Image Acquisition • Camera images from YAGs & OTRs displayed on control room screens • Use switches below screens to select which camera is displayed • The cameras and switches are also connected to erlpcon1 • erlpcon1 has a frame grabber to capture images • From the MATLAB prompt: • cd \\Apsv4\astec\Projects\4gls\ERLP\Software\Matlab\imageViewer • imageViewer http://projects.astec.ac.uk/ERLPManual/index.php/ImageViewer
Image Acquisition • imageViewer main window • Select source • Grab buttonor check Auto grab box • Type filenameor click Reset to choose it automatically based on the time • Click Saveor check Auto save box • The horizontal and vertical profiles are shown alongside the image • The axes are in mm; the scales have been calibrated for each screen • Check Fit Gaussians to measure the position and width of the beam • Check Save CSV to save this information to a text file Some screens have graticules now – a document will be produced with details of these
EpicsCaClient.ProcessVariable ActiveX Object properties Name write-once String Value read/write Double Units read String is_connected read Boolean EPICS Interface • On Windows consoles, access to the control system is possible via the Channel Access protocol • The API uses standard libraries, allowing machine control over a wide variety of platforms • The programming is really easy!
EPICS Control: Excel DAQ • A simple Excel macro to set and read control system parameters • Useful for doing parameter sweeps and generating tables of results automatically parameter names in top row commands in second row \\Apsv4\astec\Projects\4gls\ERLP\Software\Excel DAQ.xls Full instructions on the wiki: http://projects.astec.ac.uk/ERLPManual/index.php/Excel_DAQ
EPICS Control: LabVIEW Strip Chart • Plot the value of a single parameter • Just type the parameter name and click ‘Run’ • Probably not that useful, but it demonstrates what can be done! \\Apsv4\astec\Projects\4gls\ERLP\Software\LabVIEW\EPICS\Simple chart.vi
EPICS Control: LabVIEW XY Graph • Plot one parameter versus another • e.g. BPM readings versus magnet settings • Maybe a bit more useful… \\Apsv4\astec\Projects\4gls\ERLP\Software\LabVIEW\EPICS\XY graph.vi
ELOG • Now features a rich-text (WYSIWYG) editor • Log entries are automatically saved as you type – no need to click ‘Submit’ • Press Ctrl-D to add a timestamp http://www.4gls.ac.uk/erlp/elog/erlplog/ Bookmarks ELOG on any console PC
Machine Status tool • Displays the status of each section of the machine in a standardised, easy to read form • Press Copy in Machine Status • Paste directly into ELOG Start Programs Controls Machine Status \\Apsv4\astec\Projects\4gls\ERLP\Software\Machine Status\Machine Status.exe
Online modelling • Mathematica-based tool to track a beam through the machine • Interfaces with EPICS • Change dipole and quadrupole settings and immediately see effect on the machine model • Includes optimisation panel Adjust dipole/ quadrupole strengths Plot betas, dispersion, beam sizes \\apsv4\ASTeC\Projects\4gls\ERLP\Software\Mathematica\ERLP controls v7.nb