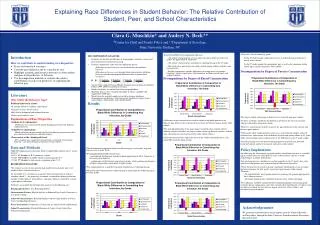
Understanding Race Differences in Student Behavior: Contributions of School and Peer Influences
10 likes | 121 Vues
This study analyzes the behavior gap between Black and White students by evaluating the impact of various demographic, academic, school, and peer characteristics. Utilizing the Oaxaca-Blinder decomposition method, the research finds that behavioral disparities persist within schools and grades, challenging assumptions about equal treatment. The study highlights the influence of socio-economic and peer contexts on behavior, suggesting that school features can both widen and narrow behavior gaps. Understanding these dynamics is crucial for addressing systemic disparities in educational environments.

Understanding Race Differences in Student Behavior: Contributions of School and Peer Influences
E N D
Presentation Transcript
Explaining Race Differences in Student Behavior: The Relative Contribution of Student, Peer, and School Characteristics Clara G. Muschkin* and Audrey N. Beck** *Center for Child and Family Policy and **Department of Sociology, Duke University, Durham, NC DECOMPOSITION ANALYSES • Evaluates the distinct contributions of demographic, academic, school, and peer characteristics to the behavior gap. • Estimates proportions of the total race difference due to: • differences in the distributions of characteristics that influence behavior. • differences in the processes through which characteristics influence behavior (includes unexplained differences due to unmeasured covariates). • Variant of the standard Oaxaca-Blinder decomposition method, developed by Fairlie (1999; 2006) for nonlinear outcomes. • Blacks and whites are matched on infraction probabilities. • Matching process uses a random subsample of whites, sampled with replacement 1000 times. • Means from the matched samples are used to generate nonlinear decomposition coefficients, based on logistic coefficient weights from a white model, a black model, and a pooled model. • Results • Introduction • How we contribute to understanding race disparities: • Focus on behavioral outcomes • Consider peer influence and its variation by race • Highlight academic performance measures as both student and peer-level predictors of behavior • Use decomposition methods to evaluate the relative contribution of each set of predictors to explaining the behavior gap • There are a few deviations by grade; • In the 4th grade sample, school factors serve to widen the gap in behavior in mostly white schools. • In the 9th grade sample, the unexplained gap, as well as the remaining within school gap is smallest in mostly white schools. • Decompositions by Degree of Poverty Concentration • School Fixed Effects Decompositions illustrate: • “All school” characteristics serve to reduce the gap in behavior in the later grades, by approximately 10 percent. • “All school” characteristics contribute to widening the gap in the 4th grade. • The racial gap is persistent even within schools among students with the same characteristics. • Possible explanations include: differences in sorting across classrooms (tracking), teacher expectations, discrimination and unmeasured family and student variables. • Decompositions by Degree of Racial Concentration • Literature • Why Study the Behavior Gap? • Problem behavior in school: • Is strongly linked to academic achievement. • Can persist across the life course. • May lead to delinquent and criminal behavior. • Varies consistently by race. Explanations of Race Disparities • Student-level explanations: • Differences are associated with family background factors that influence student behavior. • School-level explanations: • Black and white students attend schools with differing characteristics that are associated with behavior and achievement. • Peer context at the school/grade level: • Peer composition—grade peer characteristics associated with negative behavior—can affect behavioral outcomes for all students. • Data and Methods • 2000-2001 administrative data from North Carolina Public Schools in 117 school districts • 90,133 4th Graders in K-5 elementary schools • 72,467 7th Graders in middle schools containing grades 6-8. • 77,383 9th Graders in high schools containing grades 9-12. REGRESSION ANALYSES • We estimate a series of race-specific logit models for each grade, one set of models utilizes school fixed effects. • In our model, Yij is estimated as a negative behavioral outcome of student i attending school j —the propensity to commit a reported disciplinary infraction; includes violent offenses, drug offenses, and minor offenses reported by schools as disciplinary infractions. • Predictors are grouped for decomposition analysis in the following way: • Demographic Factors: Sex, Returning Student. • Socioeconomic Factors: Eligible for Free or Reduced Price Lunch, Parent has at least Some College. • Achieved Characteristics: Retained Student, Old-for-Grade Student, Previous Year’s Reading/English Scores. • Peer Characteristics: Proportion of Cohort that are Old-for-Grade and Retained. • School Characteristics: Parental Education of Cohort, Grade Cohort Size, Urban School Indicator. • The largest within-school gaps in behavior exist in mostly non-poor schools. • Features of schools ameliorate the difference in behavior the most in non-poor schools, followed by integrated schools. • However, school factors do little to narrow the gap in behavior in the schools with the most poor students. • Other grades show similar patterns, however as seen in the full sample, achieved characteristics explain more of the difference between and within schools in 9th grade, while socioeconomic factors explain more of the differences in the 4th grade sample. • Schools generally have the greatest mitigating power in mostly non-poor and integrated schools and the least in poor and mostly white schools. • Policy Implications • In addressing the achievement gap, policymakers should note that there is a parallel gap in student behavior, which persists across school contexts and has a strong relationship to academic performance. • School characteristics contribute to existing inequality in the 4th grade; these early school level inequalities may cement divergent behavioral trajectories. • While the structure of schools is doing “something” intentionally, or not, to reduce the behavior gap in the later grades, a persistent gap remains within schools. Therefore, • We should identify what specific factors are reducing the gap and appropriately focus efforts/resources. • Determine which factors contribute to the persistent within school gap. • Peer influence should be considered when formulating policies influencing grade retention and age composition, since they not only affect the behavior of students who are older or retained, but also have an impact on the rest of the students, and contribute to race disparities. • Differences in peer characteristics tend to explain a negligible portion of the behavior gap, however these characteristics narrow the behavior gap in mostly white schools. • The unexplained portion of the gap is largest in mostly white schools (above); utilizing school fixed effects the largest within school gap between students with the same characteristics also exist in mostly white schools (below). • Achieved characteristics explain the most of the within school differences, after school FE, in mostly black schools. • The distributional component of the race behavior gap is consistently large and increases across grade levels. • Demographic/background characteristics: • and academic performance together explain approximately 60 to 70 percent of the racial gap in behavior • explain more of the behavior gap at lower grades, while academic performance and peer composition explain more at higher grades. • Peer composition has a small but consistent contribution to widening the gap. • Measured school characteristics reduce the gap in junior high, but widen the gap in the other grades. . Acknowledgements We gratefully acknowledge research support from the National Institute on Drug Abuse, through the Duke University Transdisciplinary Prevention Research Center.