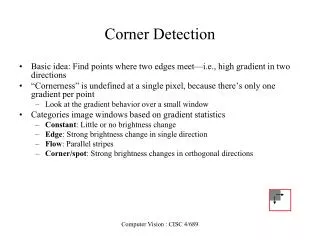
Download

1 / 11
110 likes | 253 Vues
Candice’s Corner . April 3 rd , 2014. Statistics for HCI. The important thing to remember is that statistics are another way to describe your research; they are not a magical crystal ball that spouts objective truth. Today, we will cover two ways you may chose to use statistics:

E N D
Candice’s Corner April 3rd, 2014
Statistics for HCI • The important thing to remember is that statistics are another way to describe your research; they are not a magical crystal ball that spoutsobjective truth. • Today, we will cover two ways you may chose to use statistics: • Descriptive statistics (small or large sample size); Summarize the Sample • Inferential statistics (usually larger sample size); Learn more about the population
Plan Ahead • If you think you may be interested in using statistical measures, plan ahead and design your survey intentionally. • Likert scales • Consistent measures • Same survey to compare across usability tests How do you guarantee the quality of your survey before you use it in testing?
Assumptions inform these decisions, how effective do you think users are at finding problems?
Descriptive Statistics ** Presentation of Facts Central Tendency: Average (mean) Frequency Median Measures of Dispersion: Standard Deviation Range Jakob Nielsen, www.nngroup.com
Have you considered ways you might present your data? • Tables • Charts • Graphs
Radar Chart • This is one way to display time performance or even categorical data for each user across multiple tasks.
Inferential StatisticsCreation of statistical propositions – Measure uncertainty Parameter Estimates for the Population Confidence Intervals -interval estimate of a population parameters statistical reliability. Hypothesis Testing
Online Calculators T-testhttp://www.quantitativeskills.com/sisa/statistics/t-test.htm http://studentsttest.com