Download
1 / 72
720 likes | 742 Vues
Explore the topology of protein networks in complex systems and understand how they evolve and function. Study networks in biology, physics, and the internet to uncover basic design principles and evolutionary history.

E N D
Detecting topological patterns in protein networks Sergei Maslov Brookhaven National Laboratory
What defines a complex system? • Complex system has many interacting components (1011 neurons, 104 types of proteins, 106 routers, 109 web pages) • All components are different from each other • Systems traditionally studied by physics also have many interacting components (1023 electrons in a superconductor) • But they are all the same!
Networks in complex systems • The simplest question about a complex system: who interacts with whom? • The answer can be visualized as a network • Network is the backbone of a complex system
Why study the topology of complex networks? • Lotsof easily available data: that’s where the state of the art information is (at least in biology) • Large networks may contain information about basic design principles and/or evolutionary history of the complex system • This is similar to paleontology: learning about an animal from its backbone
Complex networks are the right description when things areinterconnected
Internet From Y. Tu, “How robust is the Internet?” , Nature 406, 353 (2000)
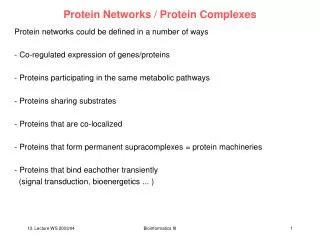
Hierarchy of bio-networks • Metabolic network: production of necessary chemical compounds • Binding network: enzymes bind to their substrates in a metabolic network and to other proteins to form complexes • Regulatory network: turns on and off particular groups of proteins in response to signals • HIGHER LEVELS: cell-to cell communication (e.g. neurons in a brain), food webs, social networks, etc.
Transcription regulatory networks Prokaryotic bacterium:E. coli Single-celled eukaryote:S. cerevisiae
General properties • Densely interconnected • Not very modular: functional modules talk to each other • Have many random features • Few proteins (hubs) interact with a lot of neighbors: but most – with just one
Out-degree Kout=5 In-degree Kin=2 in- and out-degree of nodes
from Stover et al., Nature (2000) Fraction of transcriptional regulators in bacteria
Complexity of regulation grows with complexity of organism • NR<Kout>=N<Kin>=number of edges • NR/N= <Kin>/<Kout> increases with N • <Kin> grows with N • In bacteria NR~N2 (Stover, et al. 2000) • In eucaryots NR~N1.3 (van Nimwengen, 2002) • Networks in more complex organisms are more interconnected then in simpler ones • Life is not just a bunch of independent modules!
Complexity is manifested in Kin distribution E. coli vs. S. cerevisiae vs. H. sapiens
central (hierarchical) peripheral (anti-hierarchical) Central vs peripheral network architecture random From A. Trusina, P. Minnhagen, SM, K. Sneppen, Phys. Rev. Lett. (2004)
Correlation profile • Count N(k0,k1) – the number of links between nodes with connectivities k0 and k1 • Compare it to Nr(k0,k1) – the same property in a randomnetwork • Qualitative features are very noise-tolerant with respect to both false positives and false negatives
Correlation profile of the protein interaction network R(k0,k1)=N(k0,k1)/Nr(k0,k1) Z(k0,k1)=(N(k0,k1)-Nr(k0,k1))/Nr(k0,k1) Similar profile is seen in the yeast regulatory network
Some scale-free networks may appear similar In both networks the degree distribution is scale-free P(k)~ k- with ~2.2-2.5
But: correlation profiles give them unique identities Protein interactions Internet
Null-model of a network • Distribution of degrees is non-random: the degree of every node has to be conserved in a random network • Other topological properties may be also conserved as well: • The extent of modularity (by function, sub-cellular localization, etc.) • Small motifs (e.g feed-forward loops)
given complex network random Randomization
Edge swapping (rewiring) algorithm • Randomly select and rewire two edges • Repeat many times SM, K. Sneppen, Science (2002)
Metropolis rewiring algorithm “energy” E “energy” E+E • Randomly select two edges • Calculate change E in “energy function” E=(Nactual-Ndesired)2/Ndesired • Rewire with probability p=exp(-E/T) SM, K. Sneppen: preprint (2002),Physica A (2004)
Pair of duplicated proteins Pair of duplicated proteins Shared interactions Shared interactions Gene duplication Right after duplication After some time
Yeast regulatory network SM, K. Sneppen, K. Eriksen, K-K. Yan 2003
Network properties of self-binding proteins AKA homodimers
There are just TOO MANY homodimers • Null-model • Pself ~<k>/N • Ndimer=N Pself= <k> • Not surprising as • homodimers have many functional roles
Likelihood to self-interact vs. K Fly: two-hybrid data Human: database data Pself~0.003, Pothers~0.0002 Pself~0.05, Pothers~0.0002
What we think it means? • In random networks pdimer(K)~K2 not ~K like our empirical observation • K is proportional to the “stickiness” of the protein which in its turn scales with • the area of hydrophobic residues on the surface • # copies/cell • its’ popularity (in datasets taken from databases) • etc. • Real interacting pair consists of an “active” and “passive” protein and binding probability scales only with the “stickiness” of the active protein • “Stickiness” fully accounts for higher than average connectivity of homodimers
Summary • Living cells contain many complex protein networks • Networks in more complex organisms are more interconnected • Most have hubs – highly connected proteins • Hubs often avoid each other (networks are anti-hierarchical) • Networks evolve by gene duplications • There are many self-interacting proteins. Probability to self-interact linearly scales with the degree K.
Collaborators: • Kim Sneppen – U. of Copenhagen • Kasper Eriksen – U. of Lund • Koon-Kiu Yan – Stony Brook • Ilya Mazo, Jaroslav Ispolatov, Anton Yuryev – Ariadne Genomics
Protective effect of duplicates Maslov, Sneppen, Eriksen, Yan 2003 Gu, et al 2003Maslov, Sneppen, Eriksen, Yan 2003 Yeast Worm
Protein interaction networks SM, K. Sneppen, K. Eriksen, K-K. Yan 2003
What shapes the topology of protein networks? • Duplication-divergence modelsCANaccount for their basic topological features • BUT: functional organization dominates: • Most pairs with many shared interactions are NOT homologs • Hubs are not caused by mult. duplications • Functional organization is more important than duplication-divergence
Genome-wide protein networks • Nodes - proteins • Edges – interactions between proteins • Bindings (physical interactions) • Regulations (transcriptional, protein modifications, etc.) • Etc, etc, etc.
Correlation profile of the yeast regulatory network R(kout, kin)=N(kout, kin)/Nr(kout,kin) Z(kout,kin)=(N(kout,kin)-Nr(kout,kin))/ Nr(kout,kin)
YPD full regulatory network O <-2 standard deviations O > 2 standard deviations