Download

1 / 38
380 likes | 404 Vues
This tool provides a graphically-oriented modeling interface for Applied Systems Engineering II, allowing students to build and run simulation models. It is designed to be simple and easy to use, with basic simulation services and MS Excel interface for extensibility.

E N D
Applied Systems Engineering II Designing a Discrete Event Simulation Tool Peter L. Jackson School of Operations Research and Industrial Engineering March 15, 2003 Cornell University
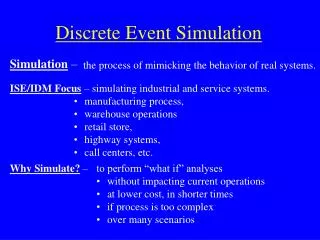
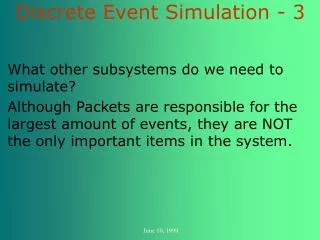
Mission • To develop a graphically-oriented discrete event simulation modeling tool for use in Applied Systems Engineering II
Requirements (Version 1.0) • The tool shall be free, public domain • The tool shall permit graphical description of simulation model • The tool shall be extensible by students • The tool shall exploit MS Excel 97+ interface • The tool shall provide basic simulation services • The tool shall be simple (minimal documentation required)
Functional Analysis Code Components Build Graphical Model Run Model, Collect Output Debug Model Analyze Output
Requirements • The tool shall not require more than two weekends of development time • The tool shall analyze a graph and construct the shell of a simulation model • Students shall provide code for model components • The tool shall run the model and store outputs (trace) • Students shall analyze the trace
Derived Requirements • Graphical model may not use text attributes on arcs (Excel 97 limitation) • Graphical model must encode all node attributes in text string (to meet development time target) • State variables for trace shall be defined by a range name • Students must code updates to range elements
Issue • What modeling approach to use? • Functional flow block diagram • Event graph • Activity diagram • Tradeoffs • Resolution • Event graph (mimic commercial software “Sigma” by Lee Schruben)
Events Conditions Triggers Delays State transitions Event cancellation Initialization On node On node Arc On node On node On arc On node Essential Functions of Graphical Model
Idea for Text String • “?condition+delay=transition” • Tokens ?,+,= identify components • Condition is function name • Delay is function name • Transition is function name • Students code functions in Visual Basic
Issues and Resolution • How to represent event cancellation? • Use dashed or dotted line type • How to represent initial event? • It is the only node that has no incoming arcs
Starting Spreadsheet: SimTemplate.xls Put your model on Sheet1 Test/run your model Check for diagnostics on sheet SimLog View output on sheet SimTrace
Sample Model Use any autoshapes and formatting that you want • What matters: • Text strings • Arc connections and direction • Arc type: solid or dashed
Analyze and Run Interaction Debug: run one event at a time First build the model and check for errors Set simulation duration Switch to view different sheets (Model, Log, Trace) as desired Run until done
Switch to Visual Basic Editor Development Code: Do not modify (all variables and objects beginning with “Sim” are reserved) User Code: Put your code here
You Write the Code: Declare Your State Variables 'Declare your variables here Global Queuelength As Integer Global ServerBusy As Integer Global CompletedCustomerCount As Long 'global means it is available for use in other modules; ‘Queuelength is the variable tracking the number of customers in the queue. 'ServerBusy will be true if the server is busy; false otherwise.
Write the Event Functions (to change the state) Function initialize() 'every simulation should have a function which initializes the state variables Queuelength = 0 'we start with an empty queue ServerBusy = False 'we start with an idle server CompletedCustomerCount = 0 End Function Function arrival() 'this represents the arrival of a customer Queuelength = Queuelength + 1 End Function Function beginservice() 'this function represents the start of service by a server. ServerBusy = True End Function Function endservice() 'this function represents the end of service by a server; the customer leaves at this point Queuelength = Queuelength - 1 'we count the customer as being in the queue until the end of service ServerBusy = False CompletedCustomerCount = CompletedCustomerCount + 1 End Function
Write the Condition Functions: to Test the State Function isidle() As Integer 'Functions that return a true/false value must be declared as integer isidle = Not ServerBusy 'ServerBusy is either true/false so Not ServerBusy is either false/true. End Function Function isqueue() As Integer If Queuelength > 0 Then isqueue = True Else isqueue = False 'this illustrates the if...then...else statement End Function
Write the Code to Generate Delays and Durations Function interarrivaltime() As Variant 'this function returns a random interarrival time; functions that return a value for time should use the variant data type Dim duration As Variant 'local variable declaration; duration will be the length of the interarrival time duration = 5 + Rnd() * 3 'duration will be a random number between 5 and 8. interarrivaltime = duration 'this is how you return a value End Function Function servicetime() As Variant servicetime = 4 + Rnd() * 3 'servicetime will be a random number between 4 and 7 End Function That's all the code required.
How a Discrete Event Simulation Works Scheduled Events Sorted in Increasing Order of Scheduled Time Time: Event: 4.0 EndService 4.3 Arrival … later times … other events Insert Event into Schedule Current Time: 3.3 Current Time: 4.0 Generate Next Event(s) with later time(s) Remove Next Scheduled Event Advance Simulation Clock Execute State Change Function If Condition Satisfied…
Common Modeling Problem: What Happens First? • Simulated robots playing soccer • Given current velocities, what happens first: • Two robots collide? • One robot hits wall? • One robot intercepts ball? • Etc. • Need to compute the time of all these events and select the minimum as the next event that really happens • Or…
Canceling Events • Schedule all possible event types: • Two robots collide • One robot hits wall • Etc. • Let the simulation determine which happens first • When any of these event types happens, cancel all other pending events of related type
More Code To Write Function Breakdown() 'no change in state; ServerBusy stays true End Function Function TimeToFail() As Variant 'this function returns a random time to fail Dim duration As Variant 'local variable declaration; duration will be the length of the time to fail duration = 5 + Rnd() * 3 'duration will be a random number between 5 and 8. TimeToFail = duration 'this is how you return a value End Function Function RepairAndServiceTime() As Variant 'this function returns a random time to repair and complete service Dim duration As Variant duration = 10 + Rnd() * 3 'duration will be a random number between 10 and 13. RepairAndServiceTime = duration 'this is how you return a value End Function
Your state variables Your range names Write Code to Store Variables Function OutputVariables() Worksheets("Sheet1").Range("Queue_Length").Value = Queuelength Worksheets("Sheet1").Range("Completions").Value = CompletedCustomerCount End Function As many variables as you want.
Input/Output • You really need to store only the variables that have changed • Code could be made more efficient • If you want to read input data from the spreadsheet (eg. Initial parameter settings), use ranges in a similar way. • Now, single step through your simulation watching your variables change with each event. • The more variables you track, the easier it will be to debug your model.
Creating a Trace • A trace is a history of your state variables after each event • The simulator automatically writes out whatever is in the range called “SimTraceRange” before and after each event • Stored on separate lines of sheet “SimTrace” • It also writes out the labels found in the range called “SimTraceLabelRange” at the head of this list. • You must define these two ranges.
Use X-Y Scatter Plot of Any Variable Over Time What a Trace Looks Like Two rows for each event: begin and end. Second row captures time spent in state (“Elapsed time”)
X-Y Scatter Plot Delete the plot to make the simulation run faster: you can add it again later
Statistics Computed After Each Run • Statistics inserted into first four lines of trace output. • Four statistics computed (Min, Max, Mean, Std. Dev.) even if they don’t make sense for your particular state variables
Project Completed Code Components Build Graphical Model Run Model, Collect Output Debug Model Analyze Output On time, on budget.