Download
1 / 22
220 likes | 324 Vues
This comprehensive analysis by Dr. Eric Girard delves into the complexities of oil pricing, exploring the intricate processes of crude extraction, refining, and market behaviors. It examines the cyclical nature of oil prices, influenced by economic demands, geopolitical tensions, and OPEC's production strategies. Key topics include the interplay of consumption, geopolitical crises, and technological advancements impacting supply. The paper also highlights historical price trends since 2003, the role of inventory levels, and the relationship between spot and futures pricing.

E N D
What is the Price of Oil? By Dr. Eric Girard Professor of Finance Hickey Chair in Business Director of the Center for Global Financial Studies
“Crude Processing” • Extraction-- Crude oil occur in the earth's crust as a result of a “million of years” decay of plants and animals. Once extracted, crude oil is transported to refineries, by ship and/or by pipeline. • The refining process-- Crude is separated into lighter groups of hydrocarbons--fuel oil , heating oil, and naphtha. • The chemistry process: naphtha is processed into olefins and aromatics; then transformed into more specialized products leading to plastic, rubber, detergents, aspirin, nylon and other synthetic fibers, paints, insulating materials...
What Price? • The crude oil price cycle may extend over several years responding to changes in demand as well as OPEC and non-OPEC supply (OPEC: Iran, Iraq, Kuwait, Saudi Arabia, Venezuela, Qatar, Indonesia, Libya, United Arab Emirates, Algeria and Nigeria). • Wide price swings in times of shortage or oversupply.
What Makes Oil Prices Swing? • Economic and Financial Forces (Consumption/ Demand) • Growth in Real GDP • Inflation • Strength of the Dollar • Reserves/Inventories • Crises and price controls • Political Forces (Production/Supply) • Wars • Conflicts • Regulations • Quotas, Embargos • Price controls
Market forces Vs. Price Controls: OPEC • OPEC has failed to time its increase/cuts in production quotas with world economic events. • Various members of OPEC produce beyond their quotas. • Non-OPEC members are producing at least as much as OPEC members.
What about Oil Reserves? Oil wells, Natural gas wells or dry holes. • Oil Reserves: Don’t know! A well guarded secret… • Lead-lag Test: oil prices weakly lead production efficiency… • In fact, technological and financial forces also affect production efficiency . • On the finance side: price risk is accounted for in the “decision to drill.” • Technological improvements have been tremendous– 3-D seismic data, directional and horizontal drilling; CO2 floods
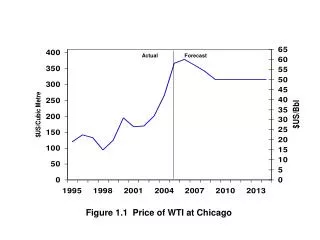
Are Oil Prices too High? • On an inflation-adjusted basis—not really. • What happened since 2003? • Increasing demand in the US, China and India, coupled with lower US and OECD countries oil inventories. The world consumes over 100 million barrels a day • Storage and refining capabilities in the US affected by hurricane season. • Iraq war and Middle East tensions • loss of production capacity in OPEC (Venezuela and Iraq): In 2003 the excess production capacity was below 2 M, as compared to 6 M in 2002; in 2004 and 2005 under 1M barrels per day. Note that if oil is too expensive, economic growth stiffens and demand for oil decreases. In addition, R&D efforts support energy saving and replacement programs.
2 Markets and 2 Quotes for Oil? • Spot Prices • Current price Per Barrels • Reflects the current settlement in cash for oil barrels • Futures Prices • Commitment to Buy/sell at a price in the future (1 month, 2 months…from today) • NYMEX (“light sweet crude oil”) • 1 contract is for 1,000 barrels • Margin deposit only and margin maintenance requires • Huge leverage (>90%)
Who Leads Who: Spot or Futures Prices? • VAR/Generalized Impulse response
Pricing Oil -- Spot and Futures • The price or “intrinsic value” of an asset is the present value of its cash flow • For a commodity—not that easy to figure out. • Traditional factor models do not work--CAPM • Well, at least the market value reflects all forces on the demand and supply sides. • Why is there a spread?
What Does R mean? • R depends on Inflation, disruption of supply, disruption of consumption, cost of transportation, extraction, storage, storage insurance, etc… • It compensates for the forces/costs associated with owning/selling the commodity. • It is an opportunity cost adapted to changes in supply and demand for the commodity • Thus, it is time varying depending on changes in financial, economic and political risk of oil exporters and consumers
Building a Fundamental Models to Price Oil • Where a =0, b is the roll-over yield, • Zt-1 are lagged conditioning financial, economic and political variables affecting exporter and consumers of oil. • et is random noise
Applying the model • Monthly data (1985-2006) • Detrended (to get rid of the seasonal demand for the commodity) • Spot price • Conditioning variables: 44 oil exporters/importers weighted-average economic, financial and political risk ratings reduced with a factor analysis. In-the-sample characteristics: • R-squared 0.61 • Roll-over yield 0.81 • Exporter impact on oil prices 18 % • Importers impact on oil prices 11 % • Unconditioned effects 32 % • Unforeseeable events 39 % • Out-of-the sample forecast—2007: $71 +/- $3
Distribution of Unpredictable MovementsNormality is rejected at the 99% level
“Predictable” Unpredictable Price Movements? • 3 clues, 1 conclusion… • Strong (significant) autocorrelation (two lags) in residuals and squared residuals unexpected event occurrences are somewhat predictable. • A regime-switching model also shows that oil futures are prone to periodically bursting bubbles. • A GARCH analysis shows that the size of an unexpected event is more important than its direction; this can only happen when bubbles form and burst. • In sum, prices are determined by periodic herding behaviors unwarranted by fundamentals…
Distribution of Unpredictable Movements • On the left side (price decrease): fat tails, narrower mid-sections. • On the right side (price increase): larger mid-section, thin tail. • More month of price increase than price decrease (autocorrelation, RS, and GARCH tests) • Hedge funds behavior • Traders behavior (closing positions) • “Technicals” self-fulfilling behaviors • Herding behavior • End-of-the quarter behavior • End of the month behavior • End-of-the week behavior • Time of the day behavior • Contract maturity behavior • Option maturity behavior
Of Utmost Importance: Volume! • Volume: a proxy for information flow and a predictor of unforeseeable market events? • Tests (EGARCH): we use detrended Volume, then we brake it down into expected and unexpected volume… • Lagged Volume predicts volatility, not the opposite • Unexpected volume moves prices • Expected volume also moves prices, but reduces volatility asymmetric access to information there is a cluster of better informed traders!!!
Concluding remarks • Oil prices are moved by political, economic and financial factors affecting demanders and suppliers of oil…not so much changes in oil reserves and production efficiency. • A “conditioned” pricing model explains 61% of futures price movements—My Prediction $71 a barrel. • A sizable portion of price movements is attributable to traders’ behaviors • Volume traded is a strong determinant of oil price volatility • Oil trading strategy should focus on volatility changes rather than price changes… • Futures options strategy are more adapted to provide investors with a “winning” solution.