Download
1 / 37
370 likes | 535 Vues
WELCOME. Bhama Consultancy Services , Pune. START. Presentation on. Importance of Tank Table Data in Hydrological Studies. Location: Aurangabad. Date: -4 th April 2012. What is Hydrology?. It is the science which deals with occurrence ,movement

E N D
WELCOME Bhama Consultancy Services , Pune START
Presentation on Importance of Tank Table Data in Hydrological Studies Location: Aurangabad Date: -4th April 2012
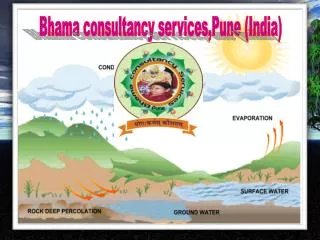
What is Hydrology? It is the science which deals with occurrence ,movement and distribution of water upon ,over and beneath the earth surface .It is in the form of cycle and known as hydrological cycle
Hydrological Cycle IT IS OBSERVATIONAL SCINCE
PRECIPITATION It is the fall of water in various forms on the earth from the atmosphere. It is in the form of rain , snow, hail, and dew Air contains gases/such as Nitrogen,Hydrogen,Oxygen ,Co2, and Water vapors
Types of Precipitation Convective Orograpic Trough Cyclonic
Spatial Distribution Rain fall measured by RG is point rain fall it varies over time and spare
Inflow A Stream Gauging Stage Gauging Stage Discharge Curve Discharge inflow B Tank Table Data Inflow=Final storage – Initial storage + spills + withdrawals
Hydrological Analysis for different • catchments in Bagh sub basin
Annual Interceptions in minor tanks, K.T. Weirs and Ex Malgujari Tanks
Model E : Schematic diagram Evapotranspiration Precipitation Surface / Soil Moisture Storage (Irrigated / Non-Irrigated Area) Quickflow Percolation Groundwater Storage Slow response flow Priority in irrigated areas is given to evapotranspiration over runoff release from soil. Whereas, in non-irrigated catchment, runoff occurs prior to evapotranspiration from the soil storage.
Snow Rain PS Potential Evapotranspiration Ep Snow Storage P Overlandflow CQOF CKIF CK12 OF Umax Surface storage IF Interflow DL Capillary Flux Lower Zone Storage Lmax BFU CKBF BF Groundwater Storage Baseflow PROM : Schematic diagram QIF PROM is the abbreviation for Precipitation Run-off Model developed on the basis of the algorithm and physical processes as outlined in the "Nedbør-Afstrømnings-Model (NAM)” model of Denmark. PROM is a conceptual model and represents various components of the rainfall-runoff process by continuously accounting for the water content in four different and mutually interrelated storages. It is based on physical structures and equations used together with semi-empirical ones.
MAPWINDOW and MWSWAT • Map Window is an open source "Programmable Geographic Information System" • Supports manipulation, analysis, and viewing of geospatial data and associated attribute data in several standard GIS data formats. It uses both grid (or raster) files & shape files (or vector) files. • MWSWAT is a plug-in for the Map Window. It is a physically-based continuous-event hydrologic model. • In MWSWAT, watershed is subdivided into a number of homogenous sub basins (hydrologic response units or HRUs) having unique soil and land use properties.
System Analysis Data Observations Recording Validation Complication Information Input System Identification Discretion Modeling System Behavior Yield Estimation output Feed Back
Sum-up • Collection of available Hydrological Data from authentic agency and its • use in analysis.-IS-norms are mostly met with. • Temporal (Monthly) and spatial (Catchment and watershed) distribution • of rainfall series through Theission Polygon and Isohyetel method. • Naturalization of inflows including up-stream interception (Monthly or • Annually) • Hydrological Modeling – Monthly R R Models • Generation of Yield series of longer durations • Estimation of post monsoon inflows. • Estimation of annual yields and reconciliation with previous yield • estimation. • Vetting from competent Authority • Presentation before the WRD-GOM, MWRRA and Stake holder • Standardization and uniformatization of Reports • Dynamic processing through feedbacks Contribution to common fund of knowledge for Hydrological scientific analysis of water resources of Godavari Khore In Maharashtra. “ The best prize that life offers is chance to work hard at work worth doings” -Theodore Resouelt
Acknowledgement Contact for further details- bhamacs07@yahoo.co.inwww.bhamaconcultancy.com