Haptic Response Profiling for Avionic Push-Button Switches
Explore the development and analysis of haptic profiles for avionic switches to enhance human-machine interaction. Featured sensors measure key switch attributes for accurate haptic characterization.

Haptic Response Profiling for Avionic Push-Button Switches
E N D
Presentation Transcript
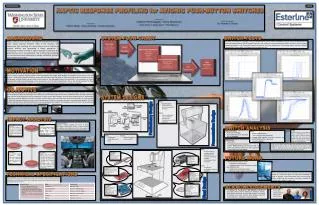
Pros: • Accommodate any size/shape switch • Easily switch from human to mechanical actuation • Self contained, stand alone unit • Cons: • Gravitational Acceleration cannot be neglected Uncertainty Axis: Unknown variables deciding the future of haptic technology include public interest in haptic features, the reliability and effectiveness of the technology and the presence of competing technology among others. SYSTEM FLOW CHART • Pros: • Visually explicit • Easily switch from human to mechanical actuation • Cons: • Poor versatility with various switches • Gravitational Acceleration cannot be neglected Scenario 1: The current state of much of the market for haptic devices, shows a high demand for haptic technology while remaining acceptable to buyers. Scenario 2: The current demand is high, yet the technology is remains in its infancy; development cannot yet respond to the call of the market. Spring 2012 EECS Senior Design – EE416 HAPTIC RESPONSE PROFILING for AVIONIC PUSH-BUTTON SWITCHES Switch Actuation System Setup: Secure Switch Upload Arduino Sketches Zero Sensors Measure Switch Characteristics: Acceleration Acoustic Signature Displacement Force Switch Transfer Preliminary Design Analysis and Profile Generation: Store Data as Text Array Identify Time Stamp Plot Data Generate Haptic Profile Profile Characterization Output Switch Profile: Switch Class Suggested Applications Presentation Design Scenario 3: This scenario appears outdated, where haptic technology was not yet impressive enough to take hold of the attention of buyers. Scenario 4: Possible, but an unlikely scenario due to recent buzz in the world of haptics, but it is possible that stakeholders in the field will no longer be interested in haptic technologies even if they have been developed fully and can be integrated into many devices. Final Design SWITCH TESTS • Pros: • Gravitational Acceleration a non-factor • Cons: • Difficulty integrating various sensors The team has elected to investigate a few key measurements for the sake of readability. In Figure 4 we see multiple trials of measured displacement of switch actuation. Figures 1 and 3 show the measured electrical transfer and force of this actuation respectively Figures 2 and 5 relate the transfer and force to the linear displacement. This concept plays a key role in haptics, “how hard do I have to push” and “when does the switch turn on.” BACKGROUND Haptics refers to the science of sensing and manipulation through touch. Haptic response therefore refers to the sensation one experiences from touching. For many devices, human interfacing requires tactility, thus generating a haptic perception. A standardized method of which a haptic response is measured and quantified has yet to be established. This is the primary challenge for manufacturers when attempting to design and deliver products where haptics is desirable. Presented by:Robert Meyer JosueOrellana Joseph SleasmanSponsored by:Esterline Technologies – KorryElectronicsJohn Green Andy Leslie Tim RobinsonWith Faculty Mentor:Dr. Thomas R. Fischer MOTIVATION One reason haptics are not more prevalent in products is an inability for technology to keep up with specifications. Consumers prefer not to invest in products featuring haptics if the functionality does match those without. An example involves touch-screen cell phones - initially buyers seemed hesitant to replace physical buttons with flat surfaces. Early touch-screen cell phones did not contain the features of those today and were often turned down for the technology buyers had more faith in. As integration of haptics improved the touch-screen technology it soon became the norm for most smart phones. This is the primary problem for those interested in the advancement of haptic technology: the idea may be there, but developers must deliver the goods. OBJECTIVE The intent of the system is to quantitatively measure the perceived physical response of avionic push button switches, specifically, those produced by Korryas show below, in an attempt to autonomously replicate the results yielded by human actuation. Measured data will then be analyzed and used to characterize a haptic profile and procedure. A sensor array measuring force, displacement, acceleration, acoustic signature and electrical switch transfer capture the essential aspects of the characterization. A microcontroller is utilized for communicating with sensors as well transmission of data to a computer via custom data acquisition software. The final product will also feature dedicated software for data representation and analysis. The strategies used by the team can be referenced by any party whose goal is to generate a haptic profile of a device. SYSTEM DESIGNS IMPACT ANALYSIS Errors Looking at Figure 2, we see some odd results. It would appear as if the switch transfers at different positions in each test. This has to do with stability of the LVDT sensor setup, as there is a slight bounce that cannot always be compensated for. • Force • Within specified limits • Fairly consistent and repeatable • Smooth slope signifies a smooth actuation (no weird discrepancies or plateaus) • Overall: Excellent • Displacement • Few outliers • The displacement itself, consistent • Overall: Good (Shaking and bouncing with the LVDT and extension plate may have explained some of the “noise” associated Based on the data collected, we can conclude that the switch analyzed, the Korry 433, is one which we can base a solid profile on. External sources and surveyors have supported this by selecting the 433 over the other switches shown. Displacement 356-1014-ND MHR 500 Linear Range: ± 12.7 mm Dimensions: 83.8 mm Linearity: ± 0.25% Sensitivity: 77 mV/V/mm Actuation ZHO-1364S-36A13 Operating Voltage: 5V to 36 V Current consumption: 2.7 A at 36V Maximum Disp.: 10 mm FUTURE WORK SWITCH ANALYSIS • Implement final design as shown • Adjustable mounting table • Integrate system (on board power supplies) • Test other switches • Compare to current information • Generate switch specific haptic profiles • Electrical Transfer • Distinct on/off stages • No shudder (electrical “bounce”) • Overall: Excellent Acoustic Signature PCM1803A Sampling Rate: 16 kHz to 96 kHz Single-Ended Voltage Input: 3 Vp-p Dynamic Range: 103 dB SNR: 103 dB THD+N: –95 dB Acceleration ADXL345: Triple Axis 10 bit resolution Operating Voltage: 3.3 V SPI connection Bandwidth: 0.05-1600 Hz Range: +/- 2g,4g,8g,16g 3 mm x 5mm x 1mm TECHNICAL SPECIFICATIONS With a standardized way to quantitatively measure the haptic profile of a switch, the goal is to apply this knowledge in order to develop a two dimensional touch screen giving a similar tactile feel and response, ultimately replacing the switches with a single, compact unit. While addressing the issues brought forth in the impact analysis, a few parameters have been considered for this design. The system features have been presented to the team per request from the sponsoring company, while the metrics and corresponding requirements are physical limitations of the test switches and measurements. Force LLB130 - FSH02941 Sensing diameter: 10 mm Sensing Range: 5 lb Accuracy 0.5% Light Weight Low Deflection 17-4 Stainless Steel Construction Subminiature Size Compression ACKNOWLEDGEMENTS Microcontroller ATmega328 8MHz external resonator DC Input: 3.3V up to 12V 3.3V Regulator Digital I/O Pins: 14 (of which 6 provide PWM output) Analog Input Pins: 6 DC Current per I/O Pin In addition to the guidance and experience from our sponsors at Korry and our mentor, Dr. Thomas R. Fischer, Team Nollet would like to thank Kirk Reinkens, Dr. Patrick D. Pedrow, John Yates and the WSU Machine Shop for their assistance in making this project possible. Left to Right: Joseph Sleasman Robert Meyer JosueOrellana Team Nollet