
Uploaded by
buzz
1 SLIDES
140 VUES
10LIKES
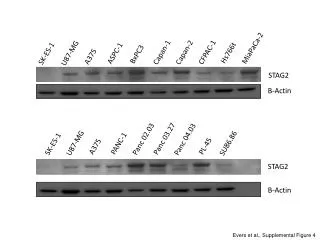
Comparative Analysis of Cancer Cell Lines and STAG2 Expression in Supplemental Figure 4
DESCRIPTION
This study presents a detailed comparison of the STAG2 expression across various cancer cell lines including MiaPaCa-2, Capan-1, Hs766t, and others. The analysis also incorporates the expression levels of β-Actin as a control. Data from supplemental figure 4 elucidates the relationship between STAG2 and tumor biology, providing insights into its potential role in cancer progression. This comprehensive overview serves as a valuable resource for researchers focusing on cancer cell biology and molecular mechanisms.
Download
1 / 1
Download Presentation

Télécharger la présentation
Comparative Analysis of Cancer Cell Lines and STAG2 Expression in Supplemental Figure 4
An Image/Link below is provided (as is) to download presentation
Download Policy: Content on the Website is provided to you AS IS for your information and personal use and may not be sold / licensed / shared on other websites without getting consent from its author.
Content is provided to you AS IS for your information and personal use only.
Download presentation by click this link.
While downloading, if for some reason you are not able to download a presentation, the publisher may have deleted the file from their server.
During download, if you can't get a presentation, the file might be deleted by the publisher.
E N D
Presentation Transcript
MiaPaCa-2 CFPAC-1 Capan-1 Capan-2 Hs766t U87-MG ASPC-1 SK-ES-1 BxPC3 A375 STAG2 Β-Actin Panc 03.27 Panc 02.03 Panc 04.03 U87-MG SU86.86 PANC-1 SK-ES-1 PL-45 A375 STAG2 Β-Actin Evers et al., Supplemental Figure 4


More Related
Audio
Live Player