Download
1 / 1
10 likes | 145 Vues
Anette Giesemann 3 · Dominika Lewicka-Szczebak 1,2 · Reinhard Well 1 1 Thünen Institute of Climate-Smart Agriculture, Germany, 2 University of Wroclaw, Poland.

E N D
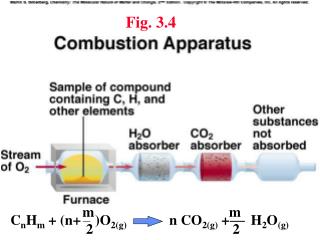
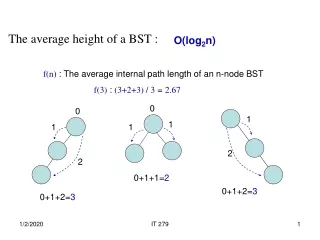
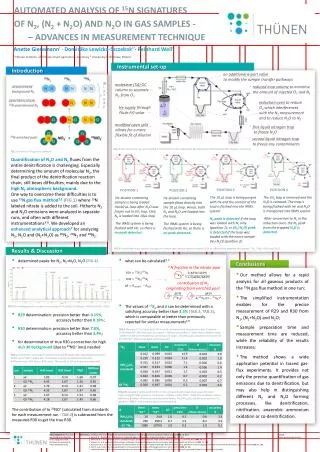
Anette Giesemann3 · Dominika Lewicka-Szczebak1,2· Reinhard Well1 1 ThünenInstitute of Climate-Smart Agriculture, Germany, 2 University of Wroclaw, Poland AUTOMATED ANALYSIS OF 15N SIGNATURES OF N2, (N2 + N2O) AND N2O IN GAS SAMPLES -–ADVANCES IN MEASUREMENT TECHNIQUE Instrumental set-up Introduction an additional 6-port valve to modify the sample transfer pathways molesieve (5A)GC column to separate N2 from O2 reduced loop volume to minimise the amount of injected O2and N2 reduction oven to reduce O2 which interferences with the N2 measurement and to reduce N2O to N2 He supply through Flush-Fill valve modified open split allows for a more flexible fit of dilution first liquid nitrogen trap to freeze N2O second liquid nitrogen trap to freeze any contaminants FIG. 2 Instrumental set-up with marked modifications to the original Gas BenchII device (Thermo Scientific, Bremen, Germany) FIG.1 Scheme of 15N gas flux method Test Headline Quantification of N2O and N2fluxes from the entire denitrification is challenging. Especially determining the amount of molecular N2, the final product of the denitrification reaction chain, still bears difficulties, mainly due to the high N2atmospheric background. One way to overcome these difficulties is to use 15N gas flux method1,2(FIG.1)where 15N labeled nitrate is added to the soil. Hitherto N2 and N2O emissions were analyzed in separate runs, and often with differentinstrumentations3-6. We developed an enhanced analytical approach7for analyzing N2, N2O and (N2+N2O) as 30N2, 29N2 and 28N2. POSITION 4 The LN2trap is removed and the N2O is released. The trap is being flushed with He and N2O is transferred into IRMS system. After conversion to N2 in the reduction oven,the N2 peak from the trapped N2O is detected. POSITION 3 The 10 μL loop is being purged with He and the content of the loop is flushed into the IRMS system. N2 peak is detected if the loop was loaded with N2 only (position 1); or (N2+N2O)peak is detected if the loop was loaded with the entire sample (N2+N2O) (position 2). POSITION 1 He-stream containing sample is being loaded into10 μL loop after N2O was frozen out in LN2 trap. Only N2 is loaded into 10μL loop. The IRMS system is being flushed with He, so there is no peak detected. POSITION 2 He-stream containing sample flows directly into the 10 μL loop. Hence, both N2 and N2O are loaded into the loop. The IRMS system is being flushed with He, so there is no peak detected. FIG.3Possibilities of gas transfer through the system with various setups of valves (A-D) to differentiate between the species: 15N2;15(N2 +N2O) and 15N2O. Results & Discussion • determined peaks for N2, N2+N2O, N2O (FIG.4) • R29determination: precision better than 0.15%, accuracy better than 0.10%; • R30 determination: precision better than 7.0%, accuracy better than 3.4%; • for determination of true R30 a correction for high m/z 30 background (due to 30NO+ions) needed • The contribution of to 30NO+(calculated from standards for each measurement run - TAB.2)is subtracted from the measured R30 to get the true R30. • what can be calculated? 3 • The values of 15XNandd can be determined with a satisfying accuracy better than 3.3%(TAB.2, TAB.3), which is comparable or better than previously reported for similar measurements4-6 Conclusions 15N fraction in the nitrate pool • Our method allows for a rapid analysis for all gaseous products of the 15N gas flux method in one run; • The simplified instrumentation enables for the precise measurement of R29 and R30 from N2,(N2+N2O) and N2O; • Sample preparation time and measurement time are reduced,while the reliability of the results increases; • The method shows a wide application potential in traced gas-flux experiments. It provides not only the precise quantification of gas emissions due to denitrification, but may also help in distinguishing different N2 and N2O forming processes, like denitrification, nitrification, anaerobic ammonium oxidation or co-denitrification. contribution of N2originating from enriched pool FIG.4 Chromatogram of a sample measurement(15XN=65%, d=290ppm, N2O/(N2+N2O) = 0.03) TAB.2Measured 15XNvalues (with SD for n=8) compared with theoretical values.Precision:CV%=mean/SD*100;Accuracy:accuracy% = D(theor-meas)/theor *100), where D(theor-meas)- difference between theoretical and measured values. The (NH4)2SO4 standards of d values 24 and 290*10-6 (each 4 samples) were measured. TAB.1 Comparison of measured and theoretical R30 values with calculated contribution of NO+ ions (30NO+ = R30 meas - R30 theor) and true-to-measured R30 ratio (R30true/meas= R30 theor / R30 meas). The results of 20 replicates are presented. TAB.3Measured dvalues (with SD for n=14), compared with theoretical values Precision:CV%=mean/SD*100;Accuracy:accuracy% = D(theor-meas)/theor *100), where D(theor-meas) - difference between theoretical and measured values. The (NH4)2SO4 standards of various 15XN (shown in TAB.2– two samples each) were measured. Contact: anette.giesemann@ti.bund.de Acknowledgements: This study was fundedbythe Deutsche Forschungsgemeinschaft. We thankUte Helmstedt for help in laboratory works. References: 1. GroffmanP. M. et al., Methods for measuring denitrification: Diverse approaches to a difficult problem. Ecol Appl 2006, 16, 2091. 2. HauckR. D. , BouldinD. R.,. Distribution of Isotopic Nitrogen in Nitrogen Gas during Denitrification. Nature 1961, 191, 871. 3. MulvaneyR. L., Determination of N-15-Labeled Dinitrogen and Nitrous-Oxide with Triple-Collector Mass Spectrometers. Soil Sci SocAm J1984, 48, 690. 4. StevensR. J. et al. Automated-Determination of Nitrogen-15-Labeled Dinitrogen and Nitrous-Oxide by Mass-Spectrometry. Soil Sci Soc AmJ 1993, 57, 981. 5. Russow R. et al., Accuracy and precision for measurements of the mass ratio 30/28 in dinitrogen from air samples and its application to the investigation of N losses from soil by denitrification. Isot Environ Healt S 1996, 32, 289. 6. Well R. et al., Continuous flow equilibration for mass spectrometric analysis of dinitrogen emissions. Soil Sci Soc Am J 1998, 62, 906. 7. Lewicka-Szczebak D. et al., An enhanced technique for automated determination of 15N signatures of N2, (N2 +N2O) andN2O in gas samples. Rapid Commun Mass Sp (in press)