First half year 2011 Industrivärden , July 5, 2011
150 likes | 344 Vues
“Long-term industrial developer of listed Nordic companies”. First half year 2011 Industrivärden , July 5, 2011. Company in brief. Established: 1944 Stock: Listed on NASDAQ OMX Nordic, Stockholm Market cap: Approx. EUR 5 bn (SEK 43 bn ) Free float: Approx. 40% of shares

First half year 2011 Industrivärden , July 5, 2011
E N D
Presentation Transcript
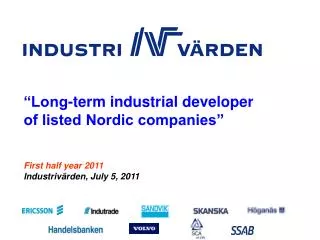
“Long-term industrial developer of listed Nordic companies” First half year 2011 Industrivärden, July 5, 2011
Company in brief • Established: 1944 • Stock: Listed on NASDAQ OMX Nordic, Stockholm • Market cap: Approx. EUR 5 bn (SEK 43 bn) • Free float: Approx. 40% of shares • Rating: S&P; A/stable/A-1 • No. shareholders: 50,000 • Average daily trading vol.: Approx. 250,000 Class A-shares 430,000 Class C-shares • Coverage (selection): Handelsbanken Markets, Jaan Köll +46 8 710 1000 Goldman Sachs, Markus Iwar +44 20 7552 1264 UBS Nordic, David Halldén +46 8 453 73 00 Credit Suisse, Leo Vicars, +44 20 7888 12 53 Deutsche Bank, Hans Derninger, +46 8 463 55 00
– Long-term industrial developer of listed Nordic companies Ericsson Volvo SSAB Sandvik SCA Skanska
Strong base for value creation Our competitive advantages Our portfolio Holding Market value, Portfolio Share of SEK bn share, % votes, % Sandvik 15.8 23 12.0 Handelsbanken 13.7 20 11.5 Volvo 11.9 18 12.7 Ericsson 6.9 10 13.8 SCA 6.5 10 29.1 SSAB 5.4 8 22.6 Skanska 3.7 5 24.4 Indutrade3.0 4 36.8 Höganäs 1.1 2 10.0 Total AUM 67.9 100 Long-term active ownership Blue-chip portfolio Leveraged influence Extensive structural capital As per June 30, 2011 Our rating Standard & Poors: A/stable/A–1 A strong, competitive long-term track record with limited risk
Focused strategy Strong value potential and long-term perspective Conditions Portfolio Scope: Concentrated portfolio – focus Sectors: Sector generalist Business models: Geographically scalable Cash generation: Good ability Ownership Major owner with board representation Evaluation horizon: 5-8 years Requirement: Strong potential for value creation Individual investments Market value: Large and midcap companies Type: Listed stocks Geography: Nordic companies Business cycle: Expansion or management phase Exit: Appropriate exit once target value has been achieved
Long-term value creation Development of net asset value SEK/share 187 181 +10% annually during the last 20 years period (incl. reinvested dividends) 135 52 32 58 23
6M:2011 in brief • Net asset value SEK 52.0 or SEK 135/share • Total return of -5% for the Class A-shares and -1% for Index • Share purchases for a total of SEK 3.5 bn, net of which purchases in Volvo of SEK 1.6 bn
Equities portfolio Net debt Net asset value Debt-equity ratio Net asset value after full conv. Debt-equity ratio after full conv. Net asset value SEK per share SEK billion Dec. 31 2010 184 -35 149 19% 144 13% • June 30 • 2011 • 176 • -41 • 135 • 23% • 132 • 11% • June 30 • 2010 • 153 • -33 • 120 • 21% • 118 • 14% Dec. 31 2010 71.1 -13.4 57,7 June 30 2011 67.9 -15.9 52.0 June 30 2010 58.9 -12.6 58.9
Why invest in Industrivärden? 91 92 93 94 95 96 97 98 99 00 01 02 03 04 05 The average annual excess return for last twenty years was 1%-pt/year Total Return Index 1232 1000 Industrivärden C 800 Return Index 600 400 200 06 07 08 09 10 11 As per June 30, 2011
Active ownership in brief Focus on value enhancement drivers: strategy, development and positioning Board participation/owner cooperation Company, competitors and industry Analyst presentations Megatrends In-depth analysis Nominating committee participation Company visits Value creation Ownershipagenda incl. action plan Database monitoring Direct dialog with company management AGM participation
Active ownership in practice SSAB Handelsbanken • Martin Lindqvist new CEO. • New market-oriented organization. • Cost-cutting program has had faster impact than planned. • Acquisition of IPSCO’s North American steel mills and coming capacity investments in North America strengthen position as leading player and enable continued global expansion. • Consistently applied business model. • Organic growth in home markets in the Nordic countries and the UK. • Strong financial and market position in a turbulent environment. Ericsson • Strong position ahead of operators’ investments in next generation of telecom systems (LTE) • Favourable growth in Services segment. • Acquisition of Nortel’s U.S. mobile systems business, together with central customer contracts, makes Ericsson a leader also in North America. Sandvik • OlofFaxander new CEO. • Consolidation of completed acquisitions. • Restructuring program designed to adapt costs and production capacity to market situation. SCA Skanska • Efficient construction operation generates good cash flows. • Proven model for value-creating project development. • Strategic focus on environmentally adapted, energy-efficient solutions. • Focus on profitable growth with strong brands in hygiene segment. • Efficiency improvement measures in packaging operations. • Extensive restructuring in product portfolio. Höganäs Volvo Indutrade • OlofPersson new CEO as from Sept. 2011. • Acquisition-driven expansion and broadened product programs in Asia. • Development of new, own platform of medium-duty engines. • Strong focus on collaboration with customers in new product development. • Acquisition of U.S. powders business. • Continued company acquisitions. • Decentralized business model. • Establishment in new geographic markets. • Strong position in energy segment.
Our portfolio of blue-chip companies 11.9 15.8 13.7 6.9 Through innovative, custom-tailored product development and high quality, the company has a world-leading position in commercial transport solutions Through a niche focus and strong position in R&D, the company has built up a world-leading position in materials technology with products primarily in the manufacturing and mining industries A decentralized branch operation with local customer responsibility has resulted in high level of customer satisfaction and enables good profitability The market’s largest and most profitable supplier of mobile telecom systems, with a leading position in telecom development 23% 18% 10% 20% 5.4 3.7 3.0 6.5 Uniqe, comprehensive know-how in construction combined with process focus has resulted in a leading construction company with value-creating project development By combining sales of industrial consumables with strong organic growth and a well-developed model for acquisition-based growth, the company has been able to show impressive profitability World-leading position in the niche segment of quenched steels and advanced, high-strength sheet creates solid base for growth and high profitability The leading European manufacturer of personal care products, with rapidly growing niche products, as well as packaging solutions 8% 5% 4% 10% 1.1 Marketvalue SEK bn Portfolio value: SEK 67.9 bn Market leader in the growing niche of metal powders, used primarily for component manufacture in the auto industry Portfolio share, % 2% As per June 30, 2011
Strong financial position Net debt-equity ratio Interest bearing net debt (SEK bn) SEK 15.9 bn 23% June 30 Dec 31 June 30 SEK bn201120102010 Listed stocks 687159 Net debt -16 -13-13 Net debt eq. ratio 22%19%21% Net debt eq. ratio a. full conversion 11%13%14% S&P rating : A/stable/A–1
High dividend yield Bonus dividend Ordinary dividend SSEX dividend yield Dividend yield 3.3% 3.2% Dividend: 4.18 2.90 2.75 3.00 3.50 4.50 5.00 4.50 3.00 4.00 SEK/share Of which ordinary 2.50 2.50 2.75 3.00 3.50 4.50 5.00 4.50 3.00 4.00
Industrivärden online Reuters code INDUa.ST Bloomberg code INDUA SS www.industrivarden.net info@industrivarden.se +46-8-666 64 00 +46-8-661 46 28 Box 5403, SE-114 84 Stockholm, Sweden