Download
1 / 25
250 likes | 310 Vues
Learn how to calculate mean, median, and mode to find the center of data sets. See examples and implications of each measure.

E N D
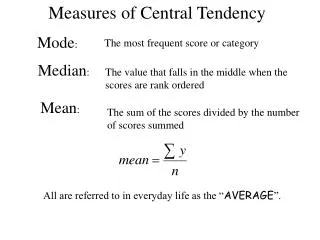
MEASURES OF CENTRAL TENDENCY The measure of central tendency measures the centrality or center of a data set. These measures are the mean, median and the mode.
Mean The mean of a numeric variable is calculated by adding the values of all observations in a data set and then dividing that sum by the number of observations in the set. This provides the average value of all the data.
Mean: Sample and Population Mean = sum of all observations divided by the number of observations
Example: Mean Mount Rival hosts a soccer tournament each year. This season, in all their 10 games, the lead scorer for the home team scored 7, 5, 0, 7, 8, 5, 5, 4, 1 and 5 goals. What was the mean score?
Example: Mean Since we included all the 10 games of Mount Rival, we compute the population mean. It is given by
Example: Mean A marathon race was completed by more than 100 participants. A sample of 5 participants were taken and their race times were recorded (in hours) as follows: 2.7, 8.3, 3.5, 5.1 and 4.9. What is the mean race time of the 5 participants?
Example: Mean The mean race time of the sample of the 5 participants is 4.9 hours.
Interpreting the Mean Consider the mean first quiz scores for two different freshman sections in Science: Section X Section Y 72.7 69.8 Which of the two sections got a higher score?
Interpreting the Mean The following are the times (in minutes) that new employees need to learn a job from two companies and their means: Mean Company A: 25, 19, 30, 27, 22 24.6 Company B: 24, 23, 27, 29, 24 25.4 Which company has fast-learning new employees?
Remark: Mean The mean is the most commonly used measure of central tendency and is the best measure when comparing two or more sets of data. However, it is affected by extreme values.
Median The median of a set of observations arranged in an increasing or decreasing order of magnitude is the middle value when the number of observations is odd or the arithmetic mean of the two middle values when the number of observations is even.
Example: Median On 5 term tests in sociology, a student has made grades of 82, 93, 86, 92, and 79. Find the median for this test grades. No. of observations: n = 5 (Odd) Ascending Order: 79, 82, 86, 92, 93 Median: 86
Example: Median The nicotine contents for a random sample of 6 cigarettes of a certain brand are found to be 2.3, 2.7, 2.5, 2.9, 3.1, and 1.9 milligrams. Find the median.
Example: Median No. of observations: n = 6 (Even) Ascending Order: 1.9, 2.3, 2.5, 2.7, 2.9, 3.1
Position of the Middle Values • If the number of observations (n) is odd, then the position of the middle value is the observation. • If the number of observations (n) is even, then the position of the two middle values are the and observations.
Interpreting the Median Suppose that the median of the final exam score of a particular class in Mathematics is 62 points. What is the implication of this value? This means that 50% of the class scored 62 or more in the Mathematics final exam.
Remark: Median The median is not affected by extreme values. It is the best measure of center in terms of position in an arranged sequence. Often, it is used for curving or adjusting values to fit in a normal distribution.
Mode The mode of a set of observations is that value which occurs most often or with the greatest frequency.
Example: Mode The following are the IQ scores of 10 teenagers: 89, 82, 84, 82, 87, 95, 79, 84, 82, 87 The mode of the data set is 82 with the highest frequency 3.
Remark: Mode • For some sets of data, there may be several values occurring with the greatest frequency in which case we have more than one mode. • The mode does not always exist. This is certainly true if each distinct observation occur with the same frequency.
Example: Mode Consider the following sets of data: Data Set 1: 10, 20, 20, 30, 40, 40, 50, 60 Data Set 2: 7, 3, 6, 4, 6, 4, 3, 7, 4, 6, 3 For data set 1, there are two modes, 20 and 40. For data set 2, there are three modes, 3, 4 and 6.
Example: Mode Consider the following sets of data: Data Set 1: 90, 97, 98, 97, 90, 98 Data Set 2: 89, 88, 92, 95, 98, 97, 91, 94 The two sets of data have no modes.
Remark: Mode The mode is not the best measure of center since not all data sets can possess this value. However, the mode is the only measure that may also be used for qualitative data.
Comparing two sets of data Consider the following sets of data: 1st set of data: 9, 10 and 11 Mean = 10 2nd set of data: 1, 10 and 19 Mean = 10 What is the difference between the two sets of data?