Understanding Experimental Design: Independent and Dependent Variables in Research
This document outlines a comprehensive method for conducting experiments, focusing on how to identify and manipulate independent and dependent variables. It details the steps involved in testing hypotheses, including the use of experimental and control groups, as well as various levels of independent variables. The document also discusses reliability and validity in measurements, providing insights into assessing the effectiveness of different variables in influencing behavior. Clear examples are used to illustrate the principles of experimental design, making it accessible for researchers.

Understanding Experimental Design: Independent and Dependent Variables in Research
E N D
Presentation Transcript
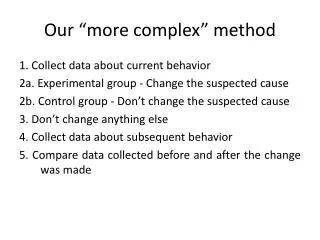
Our “more complex” method 1. Collect data about current behavior 2a. Experimental group - Change the suspected cause 2b. Control group - Don’t change the suspected cause 3. Don’t change anything else 4. Collect data about subsequent behavior 5. Compare data collected before and after the change was made
Experiments • The method that has been discussed thus far is referred to as an Experiment • Variations on this method are the primary ways that researchers try to establish that one thing causes something else to happen
Independent Variables • The aspects of the study that vary across time or across groups are known as Independent Variables • This will also be referred to as the manipulation in a given study • The manipulation will have, at least, two levels (sometimes called conditions)
Our experimental designs • Experimental group • Pre-Test, Verbal Training w/ Feedback, Post-Test • Control group • Pre-Test, Verbal Training w/o Feedback, Post-Test
Our Independent Variables • Feedback • Two conditions, i.e., with and without feedback • Session • Three levels, i.e., Pre-Test, Training, Post-Test
Kinds of Independent Variables • Between-Subjects • Each participant receives only one condition of the Independent Variable • Within-Subjects • Each participant receives every level of the Independent Variable
Our Independent Variables • Between-Subjects • Feedback • Two conditions, i.e., with and without feedback • Within-Subjects • Session • Three levels, i.e., Pre-Test, Training, Post-Test
Kinds of Independent Variables • Manipulated • The researcher has control of these Independent Variables and can change them • Subject • The researcher does not have control over these Independent Variables, i.e., cannot change them • This lack of control prevents a research from being able to establish whether or not the Independent Variable caused something to happen • Studies with Subject variables are referred to as Quasi-Experiments
Our Independent Variables • Both of our Independent Variables (Feedback and Session) are Manipulated variables
Experiment 1 Tipping Attentiveness
Experiment 2 Tipping Attentiveness
Experiment 3 Tipping Attentiveness
Experiment 4 Tipping Attentiveness
Summary • Two studies showed that attentiveness does not affect tipping • One study showed that attentiveness helped tipping, while a different study showed that attentiveness hurt tipping • What would you conclude?
Benefits of > 2 IV Levels Tipping Attentiveness
Dependent Variables • The data that you collect, as part of the logical method described earlier, is known as the Dependent Variable
Our Dependent Variable • Accuracy • | (Estimated Distance - Actual Distance) | • Notes • The estimated distance refers to verbal and active estimates of distance
Identifying IVs and DVs • What behavior do the researchers measure? • That is the Dependent Variable • What do the researchers think influences (affects) the behavior being measured? • That is the Independent Variable • What two (or more) elements make up the Independent Variable? • Those are the conditions or levels of the Independent Variable
Types of IVs • Is the influence something that the researcher can control? • If yes, then it is a manipulated IV • If no, then it is a subject IV • Was the influence distributed across groups? • If yes, then it is a between-subjects IV • If no, then it is a within-subjects IV • What behavior do the researchers measure? • That is the DV • What do the researchers think influences (affects) the behavior being measured? • That is the IV • What two (or more) elements make up the Independent Variable? • Those are the conditions or levels of the IV
Relations Between IV Types • Manipulated • Can be between-subjects or within-subjects • Subject • Can ONLY be between-subjects
Do I have a good measure? • To answer this question, researchers have to assess the reliability and the validity of their measures • Both of these are qualities that you want in a measurement
Do I have a good measure? • Reliability • Do you get the same measurements if you make the measurements again?
Do I have a good measure? • There are two common ways to examine the reliability of a measure • Split-half • Correlate the two halves of the measurement device • Test-retest • Give the measure • Give it again at a later date (usually after a week or two, if the thing being measured is a trait) • Correlate the two scores
Do I have a good measure? • Validity • Are you measuring what you think you are measuring? • Different ways to assess • Face Validity • Criterion Validity • Construct Validity
An example … • Farmer & Sundberg (1986) developed a scale of boredom proneness, which I will use as an example of how people validate a new measure • Farmer, R., & Sundberg, N. D. (1986). Boredom proneness: The development and correlates of a new scale. Journal of Personality Assessment, 50, 4-17 • They examined the Face, Criterion, and Construct Validity of their new measurement device
Do I have a good measure? • Face Validity • Does the measurement device appear to be measuring what you think you are measuring? • For example, asking someone directly about their level of anxiousness has more Face Validity than inferring it from the number of times that he/she gets up out of a seat
Farmer & Sundberg (1986) • There is no formal assessment technique for face validity • In this case, you look at what questions are asked, e.g., “Frequently when I am working I find myself worrying about other things”, or “I am good at waiting patiently”
Do I have a good measure? • Criterion Validity • Does the measurement device give similar results to other ways of assessing the topic? • For example, does your new schizophrenia scale correlate with ratings of schizophrenia made by trained professionals?
Farmer & Sundberg (1986) • Farmer and Sundberg (1986) correlated their new measure with • Self-rating of general boredom and interest • Self-ratings of boredom and interest in a specific class • A measure of boredom susceptibility • A measure of boredom at work
Do I have a good measure? • Construct Validity • Is the construct being measured unique and separate from other similar constructs? • For example, is mental workload really different from stress?
Farmer & Sundberg (1986) • Farmer and Sundberg (1986) correlated their new measure with measures of • Depression • Hopelessness • Perceived effort • Loneliness • Experience seeking • Life satisfaction • Course grades
Summary • The logic of establishing cause-and-effect • Independent Variables • Manipulated Variables • Subject Variables • Dependent Variables • Reliability • Validity