Kirkpatrick-Baez Focusing Mirrors
Kirkpatrick-Baez Focusing Mirrors. The table-top Kirkpatrick-Baez mirrors use four-point benders and flat, trapezoidal mirrors to dynamically form an ellipsis. They can focus a 300x300 m m beam to 1x1 m m - a flux density gain of 10 5 .

Kirkpatrick-Baez Focusing Mirrors
E N D
Presentation Transcript
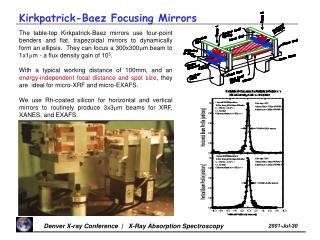
Kirkpatrick-Baez Focusing Mirrors The table-top Kirkpatrick-Baez mirrors use four-point benders and flat, trapezoidal mirrors to dynamically form an ellipsis. They can focus a 300x300mm beam to 1x1mm - a flux density gain of 105. With a typical working distance of 100mm, and an energy-independent focal distance and spot size, they are ideal for micro-XRF and micro-EXAFS. We use Rh-coated silicon for horizontal and vertical mirrors to routinely produce 3x3mm beams for XRF, XANES, and EXAFS.
X-ray Absorption Fine-Structure in Fluorescence Mode Matt Newville Consortium for Advanced Radiation Sources University of Chicago / Advanced Photon Source EXAFS, XANES, and x-ray fluorescence measurements Energy and Wavelength Dispersive Detectors for fluorescence Combined XRF measurements/mapping and XANES/EXAFS Examples: EXAFS: coordination and elemental association of Sr in coral aragonite used for sea temperature determination, using Energy Dispersive detector. XANES: speciation of trace levels of Au in FeAsS with a microfocussed beam and Wavelength Dispersive Spectrometer
X-ray Fluorescence Spectroscopy X-ray Absorption X-ray Fluorescence Incident x-ray is destroyed. Core-level electron destroyed. Photo-electron ejected from atom. Higher energy core electron fills empty electron level, and ejects an x-ray of fixed energy. Ka : L electron fills K hole Kb : M electron fills K hole
X-ray Fluorescence: Measure characteristic x-ray emission lines from de-excitation of electronic core levels for each atom. X-ray Fluorescence Spectroscopy Element Specific: Elements with Z>16 can be seen (at the APS), and it is usually easy to distinguish different elements. Quantitative: precise and accurate elemental abundances can be made. x-ray interaction with matter well-understood. Low Concentration: concentrations down to a few ppm can be seen. Natural Samples: samples can be in solution, liquids, amorphous solids, soils, aggregrates, plant roots, surfaces, etc. Small Spot Size: measurements can be made with spot sizes of a few microns. Combined with Other Techniques: XANES, EXAFS, XRD
X-ray Absorption Spectroscopy: Measure energy-dependence of the x-ray absorption coefficient m(E) [either log(I0 /I) or (If / I0 )] of a core-level of a selected element X-ray Absorption Spectroscopy: XANES and EXAFS Element Specific: Elements with Z>20 can have EXAFS measured at the APS. Valence Probe: XANES gives chemical state and formal valence of selected element. Local Structure Probe: EXAFS gives atomic species, distance, and number of near-neighbor atoms around a selected element.. Low Concentration: concentrations down to 10 ppm for XANES, 100 ppm for EXAFS. Natural Samples: samples can be in solution, liquids, amorphous solids, soils, aggregrates, plant roots, surfaces, etc. Small Spot Size: XANES and EXAFS measurements can be made on samples down to ~5 microns in size. XANES = X-ray Absorption Near-Edge Spectroscopy EXAFS = Extended X-ray Absorption Fine-Structure
X-ray Absorption An atom absorbs and x-ray of energy E, destroying a core electron with energy E0 and creating a photo-electron with energy (E-E0). The core level is refilled, causing a fluorescence x-ray or an Auger electron to be ejected from the atom. The fluorescence probability is proportional to the absorption probability. The absorption probability m(E) depends on the spatial overlap of the core-level and photo-electron wave-functions. The core-level is localized, so the overlap is determined by the photo-electron wave-function at the absorbing atom. For an isolated atom,this is a smooth function of energy.
X-ray Absorption Fine-Structure Spectroscopy With another atom nearby, the photo-electron can scatter from the neighbor atom. The interference of the outgoing and scattered waves alters the photo-electron wave-function at the absorbing atom, modulating m(E). XANES: the near-edge m(E) depends on the electronic overlap between central and bonding atoms: valence coordination chemistry. EXAFS: the oscillations in m(E) depend on: near-neighbor distance near-neighbor species coordination number.
The EXAFS Equation EXAFS: the fine-structure oscillations in m(E) where k is the photo-electron wavenumber: The EXAFS results from an outgoing photo-electron scattering from a neighbor atom, and returning to the core atom to interfere with the core level: Outgoing photo-electron Scattering from neighbor atom (amplitude and phase depend on Z of neighbor atom) Returning photo-electron The EXAFS Equation
EXAFS Analysis Measured EXAFS has a smooth background removed, and converted to k-space: Fourier Transformed to R-space numerically modelled with empirical or theoretical calculations of f(k) and d(k).
XANES X-ray Absorption Near-Edge Spectroscopy (XANES) is one of the only techniques that gives a direct measurement of chemical state (valence state) of an element. In many chemical and environmentally relevant systems, the valence state is as important as the total concentration of an element. XANES Analysis is somewhat more qualitative than EXAFS Analysis. Cr(VI) is highly carcinogenic and highly mobile in ground water. Cr(III) is not carcinogenic or very toxic, and is not mobile in ground water.
XRF / XAFS Microprobe Station at APS (Beamline 13) APS Beamline13-ID-C is a micro-beam x-ray facility for x-ray fluorescence (XRF) and x-ray absorption spectroscopy (XAS) studies: Sample Stage: x-y-z stage, 0.1mm resolution Incident Beam: Monochromatic x-rays from LN2 cooled Si (111) Fluorescence detector: 16-element Ge detector [shown], Si(Li) detector, Lytle Detector, or Wavelength Dispersive Spectrometer at 90o to incident beam Optical Microscope: (5x to 50x) with external video system Data Collection: Flexible software for x-y mapping, traditional XAFS scans, XAFS scans vs. sample position. Focusing:Horizontal and Vertical Kirkpatrick-Baez mirrors
X-ray Fluorescence Detector: Energy Dispersive Solid-State Multi-Element Ge Detector for X-Ray Fluorescence detection Ge solid-state detectors have energy resolutions of ~250eV, which separates most fluorescence lines from different elements. They allow a full XRF spectrum (or the windowed signal from several lines) to be collected in seconds. Ge detectors are limited in total count rate to ~100KHz, so multiple elements (10 to 30) are used in parallel to make one large detector. Detection limits are at the ppm level for XRF. XANES and EXAFS measurements of dilute species (~10ppm) can be measured.
On a micron-scale (ie, growth-scale), how constant is Sr/Ca ratio? How is the Sr incorporated in the coral? XRF and XAFS Example: Sr in coral aragonite Nicola Allison, Adrian Finch (Univ of Brighton, Univ of Hertfordshire, UK) Motivation: Sample Preparation: The abundance of Sr in aragonite (CaCO3) formed by corals has been used as an estimate of seawater temperature and composition at the time of aragonite formation, and so used as a paleothermometer. Sections of coral (P. lobata, ~50years old), were collected in the South Pacific, and polished into thin sections (~50mm). Some sections were C-coated for electron microprobe measurements. XRF Mapping Measurements: With an incident x-ray beam (~5mm in size) at 16.2keV (just above the Sr K-edge), Sr Ka and Ca Ka fluorescence (and other trace elements) were measured simultaneously at with a multi-element Ge solid-state detector. The sample was rastered (5mm step size), and the XRF spectra was collected at each pixel over a 200mm X 300mm area.
The Sr concentration at the “hot spots” are well above the solubility limit of Sr in aragonite: Is the Sr supersaturated in CaCO3 or precipitated out into SrCO3? XRF Maps for Sr in coral aragonite Nicola Allison, Adrian Finch (Univ of Brighton, Univ of Hertfordshire, UK) XRF Maps: Ca These false-color XRF maps of Sr and Ca concentration in the coral show an incomplete correlation between Sr and Ca. The Sr/Ca ratio varies substantially on this small length scale, although this section of aragonite must have been formed at fairly constant temperature (within several days). Sr 200mm 300mm
Fluorescence XAFS for Sr in coral aragonite Since the Sr concentration was above its solubility limit (~1%) in aragonite, it was not known if Sr would precipitate out into strontianite (SrCO3: a structural analog of aragonite), or remain in the aragonite phase. Here are 2 XAFS scans from spots of relatively high and relatively low Sr concentration. The two signals are very similar, strongly suggesting that the two areas have Sr in the same local coordination.
Fluorescence XAFS for Sr in coral aragonite First and Second shell EXAFS are nearly the same for both strontianite (SrCO3) and Sr in aragonite: 9 Sr-O at ~2.59A +/- 0.02A, 6 Sr-C at ~2.98A +/- 0.02A. Third shell EXAFS shows a strong preference for Sr-Ca over Sr-Sr, at ~4.0A. A simple comparison to SrCO3 data and a theoretical simulation (and fit) of the EXAFS spectra for Sr substituted into the aragonite structure. The coral is able to trap Sr in aragonite at a super-saturated concentration, as it forms the thermodynamically less stable aragonite (compared to the calcite form of SrCO3 data).
Understanding the metal complexes trapped in hydrothermal solutions in minerals is key to understanding the formation of ore deposits. mXRF and mXAFS are important tools for studying the chemical speciation and form of these fluid inclusions. Cu 25oC Fe 25oC Cu 495oC Fe 495oC Cu speciation in Hydrothermal Fluid Inclusions John Mavrogenes, Andrew Berry (Australian National University) Natural Cu and Fe-rich brine fluid inclusions in quartz from Cu ore deposits were examined at room temperature and elevated temperatures by XRF mapping and EXAFS. Initial Expectation: chalcopyrite (CuFeS2) would be precipitated out of solution at low temperature, and would dissolve into solution at high temperature. We would study the dissolved solution at temperature. 65mm XRF mapping showed that the initial expectation was wrong, and that a uniform solution at room temperature was becoming less uniform at temperature. This was reversible.
Cl O 2.35Å 2.09Å Cu2+ Cu1+ O 1.96Å These results are consistent with Fulton et al [Chem Phys Lett. 330, p300 (2000)] study of Cu solutions near critical conditions: Cu2+ solution at low temperature, and Cu1+ associated with Cl at high temperatures. Cu speciation in Hydrothermal Fluid Inclusions John Mavrogenes, Andrew Berry (Australian National University) XAFS measurements at low and high temperature were very different. The large change in the XANES and edge position indicates a change in speciation. Low temp: Cu2+ High temp: Cu1+ Low temp (?) High temp (?) Preliminary fits to the EXAFS of the high temperature phase (below) is also consistent with Fulton et al: Cu1+ with Cl (or S) at 2.09Å, and possibly some O at 1.96Å.
Collecting Mn fluorescence with the incident be at a few well-chosen energies around the Mn K-edge, we make 3-d (X-Y-Energy) maps that give the spatial distribution of Mn oxidation states. Oxidation state maps: Mn redox at plant roots D. Schulze (Purdue University) Manganese is an essential nutrient for plants, needed for photosynthesis and response to stress and pathogens. Reduced Mn2+ is soluble and bio-available in soils but Mn4+ will precipitate (along with Mn3+) as insoluble Mn oxides. The redox chemistry of Mn in soil is complex, with both reduction and oxidation catalyzed by microorganisms. Spatially-resolved m-XANES is well-suited for mapping Mn oxidation state in live plant rhizospheres to understand the role of Mn redox reactions in a plants ability to uptake trace elements. XRF image of total Mn (left) of soil traversed by a sunflower root (dashed line) showing heterogeneous Mn and enrichment near the root. The Mn oxidation state map (right) shows both Mn2+ and Mn4+ in the Mn-rich sites, with reduction near the root.
Overlapping X-ray Fluorescence Lines Fluorescence lines from different atoms can overlap, making XRF and EXAFS measurements difficult. The resolution of a solid-state fluorescence detector (~150eV) is sometimes not good enough to resolve nearby fluorescence lines.
High Resolution X-ray Fluorescence and EXAFS The Wavelength Dispersive Spectrometer has much better resolution (~20eV) than a solid-state detector, and a much smaller solid angle. It uses a Rowland circle, not electronics, to select energies of interest. This really needs the brightness of an undulator, but complements the Ge detectors, and allows XRF and even EXAFS on systems with overlapping fluorescence lines. A typical XRF spectra with the WDS spectrometer is able to resolve fluorescence lines that would be impossible to separate with a solid-state detector.
011 vicinal face 011 vicinal face 001 vicinal face Eu is the only REE showing no zonation, but it has two valence states and two ionic sizes that straddle the size of Ca2+. Is there a partitioning of Eu based on valence state/ionic size? Sector Zoning of Rare Earth Elements in Apatites John Rakovan (Miami University) . Apatites have a high affinity for Rare Earth Elements (REE), and are often used to study petrogenesis. Heterogeneities in crystal surface structure during apatite growth can strongly alter REE incorporation. Most REEshow sectoral zoning in apatite based on ionic size. Ions larger than Ca2+ (La3+) preferring growth along the 001 face, and those smaller than Ca2+ (Sm3+) preferring the 011 face
Result: We see almost no change at all in Eu2+ / Eu3+ across the zone boundary: the ratio is ~17% Eu2+ throughout the apatite. Sector Zoning of Rare Earth Elements in Apatites Since Eu has two valence states with different ionic sizes (Eu2+ / 1.2 Å, Eu3+ / 1.3 Å), it was suggested that there may be a valence/ionic size variation in different growth zones. The bad news: There is far too much Mn in the apatite to separate from the Eu fluorescence line with a solid state detector. . Using the high resolution WDS and the microprobe, we measured the Eu XANES on several spots in the different sectors, and across a <011> / <001> boundary. X-ray counts Energy (keV)
Using the WDS for XANES: 1000ppm Au in FeAsS Louis Cabri (NRC Canada), Robert Gordon, Daryl Crozier (Simon Fraser), PNC-CAT 1000ppm Au in FeAsS (arsenopyrite): The understanding of the chemical and physical state of Au in arsenopyrite ore deposits is complicated by the proximity of the Au LIII and As K edges and their fluorescence lines. At the Au LIII-edge, As will also be excited, and fluoresce near the Au La line. Even using the WDS, the tail of the As Ka line persists down to the Au La line, and is still comparable to it in intensity. 250x250mm image of the Au La line in arsenopyrite with a 6x6mm beam, 5mm steps and a 2 sec dwell time at each point. The x-ray energy was 12KeV.
As K-edge 11.868 KeV As Ka line 10.543 KeV Au LIII-edge 11.918 KeV Au La line 9.711 KeV Using the WDS for XANES: 1000ppm Au in FeAsS Louis Cabri (NRC Canada), Robert Gordon, Daryl Crozier (Simon Fraser, PNC-CAT) CANADIAN MINERALOGIST 38, pp1265-1281 (2000) The tail of the As Ka line is still strong at the Au La energy, so using a Ge detector gave the Au LIII edge-step as about the same size as the As K edge-step, and the Au XANES was mixed with the As EXAFS. With the WDS, the As edge was visible, but much smaller, and so the Au XANES was clearer.
Using the WDS for XANES: 1000ppm Au in FeAsS Louis Cabri (NRC Canada), Robert Gordon, Daryl Crozier (Simon Fraser, PNC-CAT) With a 13-element Ge detector (at PNC-CAT: ID-20), the tail of the As Ka line was still strong at the Au La energy, so the Au LIII edge-step was about the same size as the As K edge-step, and the Au XANES was mixed with the As EXAFS. With the WDS, the As edge was visible, but much smaller, and the Au XANES was much clearer. Measuring two different natural samples of FeAsS, both with ~1000ppm of Au, we see evidence for both metallic and oxidized Au.
Fluorescence EXAFS and XANES EXAFS and XANES are powerful tools for a wide range of scientific problems EXAFS: local coordination XANES: valence state EXAFS and XANES measurements made in fluorescence mode can be combined with traditional x-ray fluorescence measurements for quantitative determination of minor and trace concentrations of heavy elements. There are few restrictions on sample preparation or elements that can be probed.