Performance of the Polish Economy During Global Turbulence: Past and Future Insights
This presentation by Jan Krzysztof Bielecki, Chairman of the Economic Council to the Polish PM Donald Tusk, explores the resilience and growth of the Polish economy amidst global economic crises over the past two decades. It highlights Poland's unique position compared to other Central and Eastern European (CEE) countries, detailing key performance indicators and future challenges. The discussion includes maps illustrating economic growth trends, trade dynamics, and essential government strategies for maintaining stability and competitiveness.

Performance of the Polish Economy During Global Turbulence: Past and Future Insights
E N D
Presentation Transcript
Performance of the Polish economy in the days of global economic turbulence„Mapping the previous 20 years and the next 20 years”Jan Krzysztof Bielecki,Chairman of the Economic Council tothe Polish PM Donald TuskTel Aviv, December, 2010
Map of the presentation • „Allaboutmaps”: • Map of Europeangrowth in crisisyear of 2009 • Panoramic map (20 years) of how we gotthere • Map of the CEE – whyyoushouldthinkcountries, not „the region” • Map of whatremains to be done • How The Economistsees the changes on the map of Europe in the next 5 years
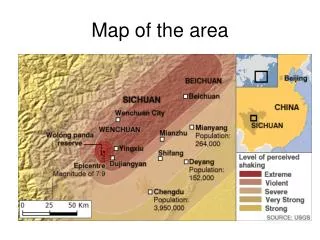
Polish economy is growing even during the time of crisis – in very tough 2009… Real GDP growth rate in Europe 2009 (y-o-y change) EU: - 4,2 Euro area: - 4,1 FIN - 7,8 NOR - 1,5 SWE - 4,9 EST - 14,1 LVA - 18,0 DNK - 4,9 LTU - 15,0 IRL - 7,1 GBR - 4,9 POL 1,7 NLD - 4,0 DEU - 5,0 BEL - 3,1 CZE - 4,2 LUX - 3,4 SVK -4,7 FRA - 2,2 AUT - 3,6 CHE - 1,5 HUN - 6,3 ROU - 7,1 SVN - 7,8 ITA - 5,0 BGR - 5,0 PRT -2,7 ESP - 3,6 GRC - 2,0 Source: European Commission CYP - 1,7 5
Poland was the first transition country to exceed its 1989 GDP level Source: EBRD, Pekao Research
Following two years of painful reforms, back on the growth track Source: EBRD Transition Report 2008
Key transition indicators suggest Poland scores very close to „best pupils in its class” * * Latvia,Estonia and Croatia were considered more advanced in banking reform... Source: EBRD Transition Report 2008
Dynamic increase of foreign trade is one of the key drivers of investments and growth Source: Statistical Office, Pekao Research
MAP OF THE CEE – WHY YOU SHOULD THINK BY COUNTRIES AND NOT BY „THE REGION”
The crisis was an „acid test” for the growth model of CEE countries…
These countries that expanded their budgets too much (often with credit booms) - suffered
Poland is less dependent from external conditions than other countries in the region Source: World Bank
Polish banking sector lent mostly in local currency – smaller FX risk Source: World Bank
Polish banking sector has almost balanced loan-to-deposit ratio – less risky than others Source: World Bank
Key challenges for the government - deficits General government fiscal balance, % of GDP Source: World Bank
Key challenges for the government - debt General government public debt, % of GDP Source: World Bank
However, indebtedness remains one of the lower ones compared to other EU countries… Source: World Bank
Lower outstanding public debt…… Source: for 2009 official data from Eurostat, and for 2010 estimates from official fiscal notifications of the countries 19
……is reflected in lower credit risk Note: CDS rates reflect cost of protection against default of debt issuer 20
…..and cost of debt servicing Note: for every country yields (in %) and spreads to Bunds (in bps) for bonds denominated in euro 21
Key challenges for the government - summary Ambitious privatization plans –almost 740 enterprises in the next two-three years Extensive infrastructure building plans (motorways, energy sector), to be boosted with EU funds. Almost 1100km of motorways under construction Challenge of maintaining fiscal discipline amid economic slowdown, ambitious infrastructure construction plans and the challenge of structural changes in economy and society
Key challenges according to the European Commission latest report - curbing structural deficit - continuing catching-up process - securing steady competitiveness gains via continuous upgrade of the export structure - maintaining macroeconomic stability Source: European Commision, „Poland – leading the pack in the recovery phase”, May 2010
Europe in 2015… by „The Economist” Source: „The Economist”, May 2010