Tables 1
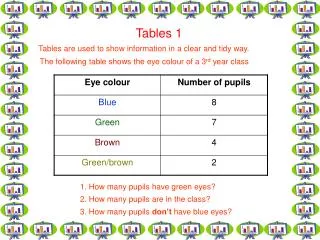
Tables 1. Tables are used to show information in a clear and tidy way. . The following table shows the eye colour of a 3 rd year class . 1. How many pupils have green eyes? . 2. How many pupils are in the class? . 3. How many pupils don’t have blue eyes? . Tables 2.

Tables 1
E N D
Presentation Transcript
Tables 1 Tables are used to show information in a clear and tidy way. The following table shows the eye colour of a 3rd year class 1. How many pupils have green eyes? 2. How many pupils are in the class? 3. How many pupils don’t have blue eyes?
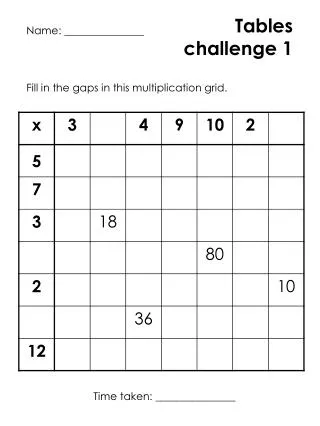
Tables 2 The following table shows the prices of fruit at a small shop. Work out the cost of these orders with a calculator. 1. 3 bananas + 2 apples 4. 2 packs of grapes 5. 3 kiwis and a banana 2. A pack of grapes and a kiwi 3. 2 apples and 2 kiwis 6. 3 packs of grapes and an apple
Tables 3 Put the following information in a table in your workbook. 1. A group of students were asked who their favourite pop star was. 6 liked Beyonce, 8 liked Rihanna, 5 liked Britney Spears and 2 liked Girls Aloud. • Another group of students were asked what job they • wanted when they left school. • 8 chose hairdressing, 5 chose construction, 3 chose a chef and 4 chose IT.
Football = 2 people Rugby Swimming Basketball Charts 1 A chart is another way of showing information. The difference between tables and charts is that charts use symbols. These can take the form of a picture or tally marks. The following chart shows the favourite sports of 3rd year. • What was the most popular sport? • How many chose rugby? • How many people were asked? • 4. How many did not choose football?
X-Factor Hollyoaks EastEnders The Bill Charts 2 The following chart shows the favourite TV shows of 3rd year. • What was the most popular programme? • How many chose the X-Factor? • How many chose EastEnders? • 4. How many were asked altogether?
Charts 3 Put the following information in a chart in your Workbook. • A group of students were asked their ideal holiday • destination. Pick a suitable symbol to represent the information. • 12 chose Florida, 8 chose Spain, 2 chose Egypt and 4 chose Australia. • A group of students were asked to name their • favourite car. Use tally marks to represent the information. • 7 chose a Porsche, 7 chose a Ferrari, 5 chose a Bentley and 12 chose a Hummer.
8 7 6 5 4 3 2 1 0 Star Harry Iron James Wars Potter Man Bond Bar graphs 1 A bar graph is another way of showing information in a clear and tidy way. This one shows the favourite films of a group of pupils. • 1. What was the most popular film? • 2. How many people chose Harry Potter as their favourite film? • How many chose Star Wars? • How many were asked altogether?
16 14 12 10 8 6 4 2 0 Puma Lacoste Nike Adidas Bar graphs 2 This bar graph shows the favourite types of trainers in a group of students. • 1. What was the most popular make of trainers? • 2. How many people chose these? • How many voted for Puma? • Which two makes got the same vote?
Bar graphs 3 Put the following information into a bar graph in your workbook. • 1. A group of students were asked their shoe size. • 4 took size 4, 6 took size 5, 9 took size 6 and 2 took • size 7. • A group of students were asked their favourite • newspaper. • 15 chose the Daily Record, 14 chose The Sun, 2 chose The Herald and 8 chose the Evening Times.
Barry Sean Nick Laura Anna Tony Following directions 1 This is a map of an area of Aberdeen. • You are standing outside • Laura’s house and are • going to go to Anna’s house. • What are the directions? 2. You are now outside Anna’s house and need directions to Barry’s house. How do you get there? • You are now standing outside Barry’s house and are going • to go to Tony’s house. What are the directions?
Following directions 2 This is a map of Mount Florida in Glasgow. Coffee shop Newsagent Bolton Drive Hill Street Flats Bank Cathcart Road Clincart Road Park Road Church Hampden Park • What streets do you go on if you walk from Hampden Park • to the coffee shop? 2. What is across the road from the bank? 3. What are the directions from the coffee shop to the church?