Download

1 / 44
440 likes | 604 Vues
Control of Population Stratification in Whole-Genome Scans. Fei Zou fzou@bios.unc.edu Department of Biostatistics Carolina Center for Genome Sciences University of North Carolina at Chapel Hill. Outline. Introduction: Genome-wide association study (GWAS) Population Stratification

E N D
Control of Population Stratification in Whole-Genome Scans Fei Zou fzou@bios.unc.edu Department of Biostatistics Carolina Center for Genome Sciences University of North Carolina at Chapel Hill
Outline • Introduction: • Genome-wide association study (GWAS) • Population Stratification • Genomic control • Principal component analysis (PCA) • Shrinkage PCA • EigenCorr • Remarks and Conclusions
Genome-wide association (GWA) study • A GWA study is an approach that involves rapidly scanning markers across the genomes of many people to find genetic variations associated with a particular disease/trait. • Single nucleotide polymorphisms (SNPs): DNA sequence variations that occur when a single nucleotide (A,T,C,or G) in the genome sequence is altered. • High Dimensional • # of SNPs: 500K/1M SNPs across the entire genome • # of samples: thousands or ten thousands
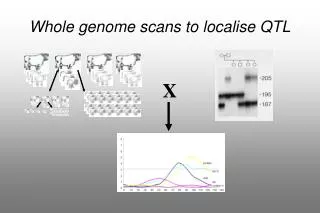
Association Mapping Cases Controls • Significant (SNP) difference in distributions? http://psb.stanford.edu/psb06/presentations/association_mapping.pdf • Copied (with modifications) from psb.stanford.edu/psb06/presentations/association_mapping.pdf
GWA Study Examples • Mar 2005: Age-related macular degeneration • Feb 2007: Type 2 diabetes • Apr 2007: Obesity • …… • http://www.genome.gov/GWAStudies/ provides a catalog of published GWA Studies. • GWA study Database: http://www.ncbi.nlm.nih.gov/gap
GWA Studies • GWA studies are • susceptibleto population stratification (Cardon&Palmer 2003; Knowler et al 1988) which occurs when • differences in disease prevalence and • differences in allele frequencies • spurious association (increased Type I error)
Population Stratification • Example:
Control of Population Stratification • genomic control and related methods attempt to find an average inflation factor to deal with overdispersion of test statistics due to stratification (Devlin and Roeder, 1999; Schork, 1999). • structured assessment of Pritchard et al., 1999, 2000a, 2000b, Satten et al. 2001) attempts to infer population origin more directly, and perform stratified testing. • principal components analysis (PCA) of Zhang, Zhu and Zhao (2001) proposed using PCA to estimate genetic background covariates
Control of Population Stratification • PCA-based methods are appealing • One disadvantage to classical PCA approach is that the number of markers cannot exceed the number of subjects • Price et al (2006) exploited the structure of rescaled genotype matrices to extend the PCA method to modern GWA studies, in which hundreds of thousands of SNPs are genotyped. • This approach (or similar) has become very popular for GWA studies.
Control of Population Stratification • Let gij represent the (i,j)th element of the genotype matrix g, corresponding to SNP i and individual j, i=1,…,M and j=1,…,N • The data are coded numerically (say according to the number of minor alleles), and typically can assume three values (0,1, or 2). • Each row i of g is (a) mean-centered; (b) variance-standardized to obtain Mx Nmatrix X. • The principal component scores for the n individuals are used to infer ancestry and used as covariates, e.g. in logistic regression • Singular Value Decomposition (SVD): where D=diag{dj}; U: loading matrix andP: normalized PC matrix. • Turns out the eigenvectors of are proportional to the principal component scores. • With K sub-populations mixed, we need K-1 PCs to represent the stratification (think of each SNP having K different SNP allele frequencies)
Control of Population Stratification • In principle one can use the entire dataset for stratification control, ranging from moderate-scale candidate gene studies to whole genome scans. • Unfortunately, the use of all available data presents a problem, as well. Both structured assessment and PCA approaches can be heavily influenced by correlated markers. • Patterson et al (2006) used a regression approach to reduce the influence of correlated markers. Fellay et al. (2007) utilized a ``thinning'' approach in which only a subset of markers with low pairwise correlation is retained for stratification control. The criteria for thinning are somewhat arbitrary, and one may lose information.
Example 1 A GWAS dataset. After filtering, 2,559 samples and 701,859 SNPs Do these clumps really represent stratification?
Example 1, cont. 8p 2q 6p 17q 6p SNP marker order SNP marker order 2q: lactase gene region; 6p: MHC region; 8p and 17q: inversion regions
In this dataset and many others, we find the same chromosomal regions showing up again and again • Some of them may be good to include (lactase gene), in the sense of corresponding to ancestry (North-South gradient in Europeans) • Some may be bad (inversions on 8p, 17q), if they are evenly mixed into the population. • Thinning of markers may be okay, but might throw out entire regions considered very plausible for association (e.g. HLA) • We desire a less extreme approach than thinning, but not too complicated.
The problem with dependent SNPs is that they will exert large influence merely due to correlation. • Principal components rewards correlation by finding directions in the data that have large variance. • We propose a shrunken genotype method instead. • Approach: create new data matrix , where w is a diagonal weight matrix that somehow “downweights” sets of correlated SNPs. • Our choice of weights follows the logic that linear combinations of genotypes should exert influence determined by the amount of independent information.
We propose the following as weights for the ith SNP, where rii’is the sample correlation of the genotype data between SNPs i and i’. We consider only nearby SNPs in a window (usually several of hundred SNPs), and above some minimum correlation threshold.
This choice of weights has the desirable properties: • When all markers uncorrelated, • If a group of M’ markers are perfectly correlated with each other, their (joint) influence on variance is reduced • If all M markers have a common positive pairwise correlation, then for a constant c, and we are back to standard PC analysis.
Example 2. Cystic Fibrosis Gene Modifier Study (M. Knowles, PI), association of genotype with lung function. 81 Ancestry-informative SNPs used for stratification control in a candidate gene study. Turned out to be self-reported African-American
Example 1 revisited with shrunken genotypes SNP marker order SNP marker order
Example 3 • With HAP-SAMPLEsoftware (www.hapsample.org), we simulated 450 CEU samples, 50 YRI samples, and 50 JP+CH samples respectively using the SNPs on the Affymetrix 100K array [Wright, et al. 2007]. We then generated an additional 225 admixed individuals using our modified version of HAP-SAMPLE. • HAP-SAMPLEgenerates data by resampling from existing phased Hapmap datasets, and therefore preserves the observed local LD structure.
standard shrinkage thinning regression
Example 4 • How methods perform for subtle population stratification. • Phase 3 CEU and TSI Hapmap unrelated samples. We removed all children whose parents are also Hapmap samples. Additionally, we excluded one CEU subject who had a very high estimated identical by descent (IBD) value (> 0.8) with another CEU subject. After filtering, the final dataset contained 185 individuals (108 CEU and 77 TSI samples). • These CEU samples are known to have the northern and western European ancestry, while the TSI samples represent Toscani individuals from Italy.
standard shrinkage thinning regression
How Many PCs • How many PCs for follow-up analyses? • Top 10 PCs (Price et al 2006) • Top 7 PCs (Sullivan et al 2008) • Tracy-Widom (TW) test (Patterson et al 2006): may select over 100 PCs • GAIN Schizophrenia sudy (162 PCs with P-values from TW test <0.01) • power • genetic effect estimate • computing time
Connection between GC and PCA • Let be the jth column of P
Connection between GC and PCA • Quantitative Trait: assuming linear model: with test statistic: By Theorem 1: which provides a direct relationship between the mean version of GC and the PC-phenotype correlations and eigenvalues.
Connection between GC and PCA • Case-control Trait: • Model • Score test statistic: • Therefore: which again provides a direct relationship between the mean version of GC and the PC-phenotype correlations and eigenvalues.
Comparison Between GC and PCA • GC and PCA related but also fundamentally different • GC: inflation factor assumed constant across all null SNPs • PCA can be viewed alternatively as control of inflation by locus specific factors
Comparison Between GC and PCA • Suppose PC1 fully recovers the two subpopulations: the test statistic Si at the ith SNP that does not acknowledge the stratification is approximately distributed as with mean where uij is the (i,j)th element of the loading matrixU
EigenCorr: Eigenvalue and Correlation Based PC Selection Procedure • EigenCorr score: reflects the effect of jth PC on the mean of the test statistics • Null distribution of the EigenCorr scores can be directly estimated under the assumption that the PCs and phenotype are uncorrelated.
Simulations • Case 1: 1000 samples with 5 subpopulations (210 samples from each of the first 4 subpopulations and 160 from subpopulation 5); 20K unrelated SNPs with model
Simulation • Set 2: schizophrenia GWAS study; 1847 samples with 810K SNPs; population stratification is simulated via the following model: • TW test: 162 PCs with P<0.01 • On average 4.95 PCs are picked by EigenCorr.
Conclusions/future directions • Shrinkage of numeric-coded genotype data appears to offer an effective means to obtain meaningful principal components for stratification analysis. But what are the optimal weights? • We find that PCs have a natural correspondence to inflation of association test statistics. i.e., PC-based covariate corrections are not arbitrary, but are in some sense a “correct” way to handle the data. • Even simple examinations of the results give information and insight about the genome. • Software is available at http://www.bios.unc.edu/~slee/sPCA/
Collaborators Seunggeun Lee Fred Wright
References – stratification control Spielman, R. S., McGinnis, R. E., and Ewens, W. J. Transmission test for linkage disequilibrium: the insulin gene region and insulin-dependent diabetes mellitus (IDDM). Am. J. Hum. Genet., 52: 506–516, 1993. Devlin B, Roeder K. 1999. Genomic control for association studies. Biometrics 55:997-1004. Schork NJ, Fallin D, Xu X, Blumenfeld M, Cohen D. 1999. The future of genetic case-control studies. Am J Hum Genet 65:A86. Pritchard JK, Rosenberg NA. 1999. Use of Unlinked Genetic Markers to Detect Population Stratification in Association Studies Am. J. Hum. Genet. 65:220-228. Pritchard JK, Stephens M, Donnelly P. 2000a. Inference of population structure using multilocus genotype data. Genetics 155:945-959. Pritchard JK, Stephens M, Rosenberg NA, Donnelly P. 2000b. Association mapping in structured population. Am J Hum Genet 67:170-181. Zhu X, Zhang SL, Zhao HY, Cooper RS. 2002. Association mapping using a mixture model for complex traits. Genetic Epidemiol 23:181-196. Zhang SL, Zhu XF, Zhao HY. 2003. On a semiparametric test to detect associations between quantitative traits and candidate genes using unrelated individuals. Genetic Epidemiology, 24:44-56. Price et al (2006) Principal components analysis corrects for stratification in genome-wide association studies. Nature Genetics 38, 904 – 909. Fellay, et al. (2007) A Whole-Genome Association Study of Major Determinants for Host Control of HIV-1. Science 317, 944
Single-SNP genome wide scan association analysis (analysis of simulated data from HapSample, www.hapsample.org) Evidence of association of case-control status with SNP marker genotype base pair position
Naive pitfalls Multiple testing error Multiple testing error -Unacknowledged dependence Hidden pitfalls -Selection bias Reproducible, global Less reproducible, or not global Technology Statistics Testing Testing/ Inference Genotype association PLATFORM Transcript profiling eQTL “Pathway” analysis Metabolomics/ Proteomics
GWAS Simulation, 100K SNPs, moderate stratification, 1000 simulation • 1800 samples from population 1 and 200 samples from population 2, where disease risk varies by population (OR 2.5). • 50K independent markers were simulated with minor allele frequency ranging from 0.05 to 0.5. • Baseline Fst was simulated from • 20 SNPs with high Fst values were simulated from U(0.1, 0.3) as highly ancestry informative. • An additional 50K SNPs simulated by using 5% of the SNPs as “seeds” within artificial LD blocks with pairwise |r| ranging from 0.75 to 0.85. Type I errors caused by the 20 highest Fst SNPs alone. Assoc. P-value threshold 10-2 10-3 10-4 10-5 10-6 Observed Fst Inflated Type I error, even at stringent thresholds
GWAS simulation, cont. – results from one of the simulated datasets Before shrinkage After shrinkage