Download
1 / 13
130 likes | 236 Vues
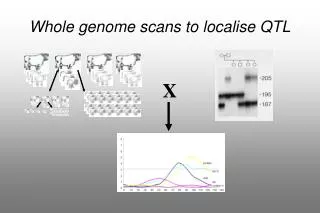
Whole genome scans to localise QTL. X. QTL to gene. Likely position. QTL. Chromosome with mapped markers. BAC Contig Spanning QTL region. New Markers. Candidate Genes. Test by association. Fine Mapping. Use in MAS. Identification of putative functional variations. Sequencing.

E N D
QTL to gene Likely position QTL Chromosome with mapped markers BAC Contig Spanning QTL region New Markers Candidate Genes Test by association Fine Mapping Use in MAS Identification of putative functional variations Sequencing
Zoo-FISH Solinas-Toldo et al (1995) Genomics 27 489-596
Comparison of maps using “Anubis” www.roslin.ac.uk/cgi-bin/anubis BL1022 1001110111100000100001100100001100100000000110001000010000000010000000000001000000000000100000 BM1827 1110110111110100000000000000000000100010000010000000010000000010000000010000000100000000000000 BM2901 1110110111110100000010000000000000100000010010001000010000000010000001100000000100000000110000 BM4028 0000010010001000000000100000000000000000000000001000010000000000000000000000000000000000000000 BM6108 1101010111100100100001100001000000100001000000000000110000000000000000000001000000000100100000 BM6116 1001010111100100100001100101001110100001000110001000010100000010000000000001000000000000110000 BM6122 1101010111100100100101100101001100100001000010000000010100000010000000000001000000000000100000 BM6404 1010110111110100000010000000000000100000010000001000010000000010000001100000000100000000010000 Map construction using “CarthaGene” www.inra.fr/bia/T/CarthaGene/
Current Roslin WGRH Map • Roslin • INRA • University of Pavia • Danish Institute of Animal Science • University of Oslo • University of Piacenza • USDA- BARC • USDA- MARC • School of Veterinary Medicine Hanover • University of Alberta • 1256 Microsatellites • 1402 Genes / ESTs • 282 AFLPs • 3826 SNPs • TOTAL 6766 (June 2005)
In OMIM HSA 65-70MB: 30 genes with known phenotypes Several with immune or reproductive function RPE65 – retinal pigment ARH1 - Ras proto-oncogene In OMIM HSA 154-157MB: 23 genes with Olfactory function
Bovine genome sequence Shotgun sequencing • Baylor College of Medicine Genome Centre • Inbred Hereford Bull • 3x Coverage November 2004 • 300,000+ plus sequence contigs • 6x Coverage June 2005 • Some assigned to chromosomes • 2.4 M SNPs • 8X “Final” Assembly due Easter 2006
Assembling the sequence Sequence reads assembled into Contigs } } } Contigs assembled into Scaffolds Scaffolds assigned and aligned on Chromosomes
Scaffolds containing marker sequences can be aligned with the Map Sequence assembly Marker Map 1 1 2 2 3 3 4 4 5 5 6 6 7 7 8 8 9 9 10 10 11 11 12 12 Unassigned 13 13
Contributions to the Composite map 17,254 distinct markers
Comparative Alignment of Genomes • Genome Evolution • Explore gene content • Function • Annotation • in process…