CAPM Betas
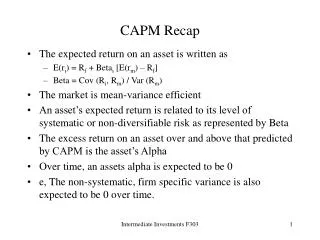
CAPM Betas. The Capital Asset Pricing Model (“CAPMâ€) [ R s - R f ] = b 0 + b 1 [ R M - R f ] + e People commonly refer to the b 0 in this model as the stock’s “alpha†and the b 1 is simply called “beta.â€


CAPM Betas
E N D
Presentation Transcript
CAPM Betas The Capital Asset Pricing Model (“CAPM”) [ Rs- Rf ] = b0 + b1 [ RM - Rf ] + e • People commonly refer to the b0 in this model as the stock’s “alpha” and the b1 is simply called “beta.” • “R” stands for return. The subscript “s” indicates that the model is for stock “s” (e.g., Coca Cola or Microsoft). The subscript “f” stands for the risk-free security (e.g., a 30-day Treasury bill). The subscript “M” stands for the stock market. • [ Rs- Rf ] is the risk premium of a stock; [ RM - Rf ] is the risk premium of the market. • The “e” designates the error term. • If you work with daily data, all your returns should be daily returns and you are calculating a daily beta of the stock. If you work with monthly data, all your returns should be monthly returns and you are calculating the stock’s monthly beta. Etc. • If you want to calculate the CAPM beta for a mutual fund or an investment portfolio, just use the returns from the mutual fund or portfolio instead of the returns of an individual stock.
CAPM Betas (continued) From earlier slide, the Capital Asset Pricing Model (“CAPM”) is: [ Rs- Rf ] = b0 + b1[ RM - Rf ] + e To estimate b0 ( “alpha”) and the b1 (CAPM “beta”), you estimate the model (i.e., perform the OLS regression): y = b0 + b1 x + e Note that [ Rs- Rf ] is “y” and [ RM - Rf ] is “x”. Don’t reverse them! You’ll need to perform all the steps. • Step 1: Collect the Raw Data. • Step 2: Calculate descriptive statistics. • Step 3: Plot the data. • Step 4: Specify the model. • Step 5: Estimate the model (i.e., perform the regression). • Step 6: Determine whether the model is good in a statistical sense.
Can outdoor temperature be estimated using cricket chirps? Step 1 – Collect the Raw Data: Go outside some evening with a thermometer. Count the number of cricket chirps you hear for 15 seconds. Repeat on various evenings when the temperature is different.
Can outdoor temperature be estimated using cricket chirps? Step 2 – Calculate descriptive statistics: Can use Excel’s formulas for mean and sample standard deviation.
Can outdoor temperature be estimated using cricket chirps? Step 3 – Plot the data: Can use Excel’s XY (Scatter) chart type. Temperature is “y”. Chirps is “x”.
Can outdoor temperature be estimated using cricket chirps? Step 4 – Specify the model: y = b0 + b1 x + e • Temperature is “y”. • Chirps is “x”. • “e” is “error”, which is the difference between our model’s prediction of temperature and the temperature we actually observed. • We’ll estimate b0 and b1 using ordinary least squares (“OLS”) regression. • If our model’s any good, once we’ve estimated b0 and b1 , we can use the following formula to estimate temperature just by counting cricket chirps: Temperature = b0 + (b1 )( # of chirps) + 0 • Note: our model assumes that “y” and “x” have a linear relationship --- i.e., our model is the equation of a line with intercept b0 and slope b1 .
How will we determine the best line? We’ll use Excel to perform an ordinary least squares (OLS) regression. ? ? ?
Can outdoor temperature be estimated using cricket chirps? Step 5 – Estimate the model (i.e., perform the regression): y = b0 + b1 x + e • We’ll need Excel’s “Analysis ToolPak” Add-In. You may already have added it. If not, here’s how you do it: • For Excel 1997-2003: On the tool bar, click “Tools”, “Add-Ins”, “Analysis ToolPak”. • For Excel 2007: On the upper left-hand corner “MS” logo, click “Excel Options”, “Add-Ins”, “Analysis ToolPak”. • If you’ve added the “Analysis ToolPak” Add-In., you’ll be able to: • For Excel 1997-2003: On the tool bar, click “Tools”, “Data analysis”, “Regression”. • For Excel 2007: On the tool bar, click “Data”, “Data analysis”, “Regression”. >>>>
Can outdoor temperature be estimated using cricket chirps? y = b0 + b1 x + e = 42.997 + 0.906 x + e
Best estimate: Temperature = 42.997 + (0.906)(Chirps) + e. In other words, the best line intercepts the y-axis at about 43, and it has a slope of about 0.9.
For each of our temperature observations, we can determine how much our model’s prediction for temperature is in error. “Predicted y” = b0 + b1 x + e = 42.997 + 0.906 x + 0 Error (“e”) = “Predicted y” – “Actual y”. For 1st observation, “Predicted y” = 42.997 + (0.906)(18) = 59.30. Error = 59.30 – 57 = 2.30.
For each of our temperature observations, we can determine how much our model’s prediction for temperature is in error. “Predicted y” = b0 + b1 x + e = 42.997 + 0.906 x + 0 Error (“e”) = “Predicted y” – “Actual y”. For 1st observation, “Predicted y” = 42.997 + (0.906)(18) = 59.30. Error = 59.30 – 57 = 2.30. Ordinary least squares (OLS) finds the line that minimizes the sum of the squared errors (e2).
It looks like our model is pretty good. We can tell how good it is in a statistical sense by examining the Adjusted R Square (R2) of the regression and the t-statistics and p-values of the coefficients. Adjusted R2 = 94.8%. This means our model has explained 94.8% of the variance of Temperature. You could look up these T-stats in a statistical table to determine whether they were significantly different from 0. It’s easier just to use the P-values. The P-values are the probability of obtaining our coefficients (b0 , b1) if they were truly equal to 0.
Step 6 – Determine whether the model is good in a statistical sense. The p-value of each of the coefficients is less than 5%. Therefore, we say each coefficient is significantly different from zero at the 5% level.The p-value of the F-stat tells us how good the model is overall. It also has a p-value less than 5%. Therefore, we say the regression is significant at the 5% level.
Suppose the p-value of the coefficient for CHIRPS had been > 5%. We would have concluded that it was NOT significantly different from zero at the 5% level.In that case, we would have to conclude that our best model for estimating temperature would be: Temperature = b0 . And b0 would just equal the average of our Temperatures (67 degrees). We would have to conclude that CHIRPS are of no help for determining outdoor temperature.